This thread has been locked.

If you have a related question, please click the "Ask a related question" button in the top right corner. The newly created question will be automatically linked to this question.

CCS5: Clipped display in Graph->Single time


Hello,

I'm currently becoming desperate because the CCS Tools->Graph->Single Time is unreliable. One of my problems:

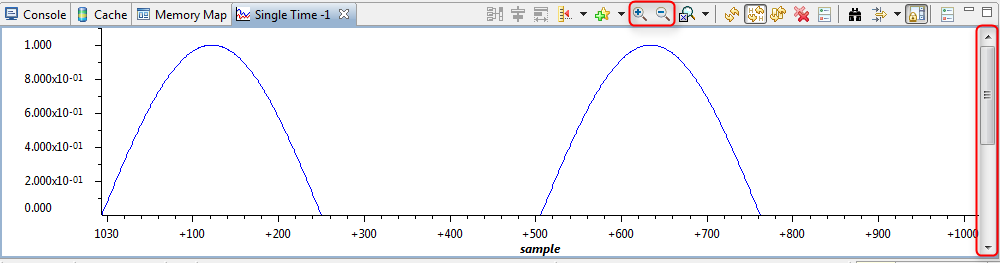
I'm not able to get the vertical scaling to display the whole amplitude. Not by using autoscale or anything else. I need to find jumps in this signal, so displaying the whole thing is absolutely vital.

It's really urgent, does anybody have ideas?

CCS has  version: 5.5.0.00077 

Thanks,

Markus

  • I forgot:

    The scale will always be in about the same range, so setting some range manually would be ok - only how?

  • Markus,

    Unfortunately setting fixed vertical axis values was a feature only implemented in CCSv6.0. However, did you try to zoom out only the vertical axis?

    Then you use the loupe buttons and the vertical sidebar to set the appropriate scale and position.

    Hope this helps,

    Rafael

  • Hello Rafael,

    wow, this has to be my longest time-to-answer... sorry for that.

    Unfortunately, when I had the problem, no zoom on the vertical axis was possible. Clicking on the loupe buttons caused no reaction by CCS.

    Back then, I changed to CCSv6 where the graphs were working. Later, I had some other problem with v6 and went back to v5 and the zooming problem was gone.

    I have to say that while the graph tools would be extremely helpfull in debugging, I don't use them anymore because they just don't work reliably. What I do instead is to dump the memory using the Memory Browser and plot in gnuplot or evaluate in octave right away. That takes much more time than using the graph tools, but it is reliable (that's valid for v6, too).

    cu

    Markus