This thread has been locked.

If you have a related question, please click the "Ask a related question" button in the top right corner. The newly created question will be automatically linked to this question.

Dual time graph of Int32 arrays displayed like Uint8 data

Other Parts Discussed in Thread: TMS320VC5502

While debugging a VC5502 application on a custom board, I captured input and output data in signed 32-bit integer (Int32) arrays with 7200 elements each. Then, I set a breakpoint in my code. At this point, I tried to use the dual time graph feature of CCSv5.5 to examine the input (testBufferA) and output (testBufferB) of a processing block.

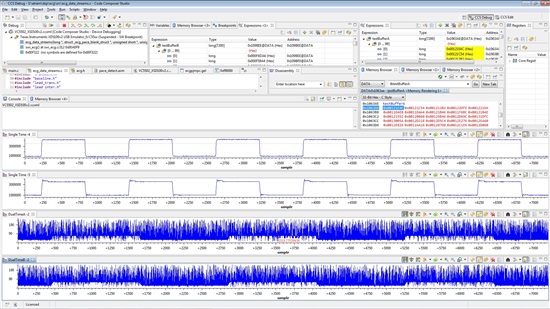
Both graphs look like they were graphed as unsigned 8-bit integer data (Uint8). See below.

Next, I used a single time graph to display the data from testBufferA. That graph looked correct.

I also used another single time graph to display the data from testBufferB. That graph looked correct too.


Here is a screen capture of my CCSv5.5 session with the goofy dual time graph on the bottom (DualTimeA-2 and DualTimeB-2), and the two single time graphs of the same two arrays (Single Time-4, Single Time-5).


Here are some details of my project:

Device: TMS320VC5502

Emulator: XDS100v2

Code Composer Studio version 5.5.0.00077 running on a Dell Precision M6800 PC running Windows 7  64-bit, Service Pack 1.

(We do not observe this behavior when we debug the same application from CCSv5.5 on Ubuntu 12.04 LTS 32-bit workstations.)

The project comes from legacy code (circa CCSv2.21) that is built from a Linux environment using the following:

TMS320C55x Code Generation Tools Release Version 2.56

DSP/BIOS 4.90.270

I created a CCSv5.5 workspace and project and imported the C/C++ Executable from the Linux build. I have been able to attach to the VC5502 target with my XDS100v2 emulator from CCSv5.5 and step through the code. We do NOT build the application from CCSv5.5.  I had to modify my gel file to get past some error messages that were appearing. I am attaching my gel file. If you find issues with my gel file, I would be grateful for any guidance.

0638.ecgpjmpc.gel

  • Hi Patrick,

    I did take a look at the Dual Graph to plot some data in 2 buffers and tried the same thing with single time (similar to what you did). However I did see the data as desired. Since it is working in the Single Time and on Linux I can rule out any Graph hardware dependent data acquisition problems. Not sure why it is plotting a 

    Could you please send me your <workspace>\.metadata\.plugins\com.ti.dvt.graph.visualization (If present). Also try deleting that folder and see if the problem goes away.

    Another experiment which would be helpful in narrowing down the issue....

    Fill byte address location "testBufferB + 7200/4 - 200" till the end of the testBufferB with 0 (could use CCS memory fill). Please send a screen shot of the Single time and Dual time graph with this experimental data pattern (same graph properties as you had, just different data)

    Regards
    Ralph

  • First, I reproduced the issue on my PC. This time I used a sinusoidal signal. The screen capture shows the dual time graph at the bottom and two single time graphs above the dual time graph.

    My <workspace>/.metadata/.plugins/com.ti.dvt.graph.visualization/ folder contains a savedSolutions/ folder that is empty.

    I filled the testBufferB[1600:7199] with zeroes using the CCSv5.5 memory fill feature and refreshed the graphs. The screen capture is attached.

    I closed CCSv5.5.
    I removed my <workspace>/.metadata/.plugins/com.ti.dvt.graph.visualization/ folder.
    I restarted CCSv5.5.
    I changed the input signal to a triangle wave.
    I filled the test buffers, stopped at my breakpoint, and graphed the data again.
    The screen capture is attached.


  • Thanks for the experiments and the screenshots. The 0s test as I was suspecting would give the best feedback as to what is the problem, will analyze.

    thanks

    Ralph

  • Ralph,

    I am on site at the customer and we are again able to reproduce the problem.  I am not seeing any obvious solution to this.  One thing to note is that the graph data is coming from external RAM on the 16-bit wide Asynch EMIF interface.

    I am wondering if this is only an issue for this C5502 target.  When I get back to my home office, I'm going to try and replicate on a VC5502 dev board and see if the same issue shows up on one of our ARM targets.

    Thanks,

    Stuart