This thread has been locked.

If you have a related question, please click the "Ask a related question" button in the top right corner. The newly created question will be automatically linked to this question.

CCSv6 Memory Leak?

Hi

Windows 7. CCSv6.0.0.00190, ti.platforms.evm6472, stairstep example, System Analyzer 1.4.0.6, CGT 7.4.8, XDX 3.25.5.94, SYS/BIOS 6.37.2.27, XDS560v2 spectrum digital emulator.

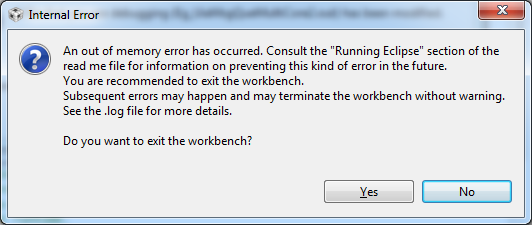
I got the error below after I left CCSv6 running overnight. 

Which is strange because the task manager says I have 18 GB RAM available. 

I have not been using CCS, but its open on my PC. The emulator is not connected. I've been checking the task manager and CCS's memory has been creeping up. Its currently at 454MB when it was at 444 MB when I first got in this morning (about 1 and a half hours ago). 

I used Process Monitor to capture file IO. Could it be the write/reads to GIT? The log is below.

http://e2e.ti.com/cfs-file.ashx/__key/communityserver-discussions-components-files/81/1401.CCsv6_5F00_MemoryLeak.7z

I've got the Clearcase plugin, and I've never configured the system to use GIT.

Its also writing to the workbench.imi file. Strange too because I'm not actively using CCS.

Cheers2u

  • I closed CCSv6 and re-opened. Its using 477MB at startup. I'm no longer sure there's a memory leak, but why windows 7 is complaining about sitting idle overnight on my PC is a mystery.

  • I don't have an explanation of why you see the Windows dialog, but here is a guess. Maybe you could keep tabs on the memory usage so we can try to determine if there is really a memory leak.

    The CCS process can use up to approx 1.5GB of commit space. If you add the commit size column to the windows task manager, you can see the current commit size. The default memory counter displayed in the task manager is the private working set. This number can change a lot as memory is swapped to the page file so it might be better to watch the commit size. The commit size will grow over time as additional heap space is allocated, but it should max out at a level that depends on what windows are open and what target operations are being performed.  If it continues to grow when CCS is idle, then there may indeed be a memory leak.  If you observe this situation, please take note of what windows are open in CCS and whether the target is connected. Perhaps screenshots of CCS and the task manager would be the simplest approach.

    As for the reason the dialog appears, one guess is there was some memory pressure in your PC while other processes were running overnight. The OS picked the process using the largest amount of memory as the likely culprit and mentioned that in the dialog.  

    When you say there was 18GB free, are you looking at the performance tab of the task manager?  The counters for the physical memory status at the bottom of the dialog are in MB. On a PC that has 8GB of physical memory, I typically see the "free" counter much less than 500MB and often only a few MB.

  • Hello,

    I have also seen Code composer's memory usage increase throughout the day (to where it goes up to over 200MB).  I am using CCSv6.0.00.190.

    Stephen

  • Stephen,

    IF you were looking at the working set, it would not be unusual for this to be over 200MB. The working set is the process memory currently loaded into the PCs physical memory. You can see large changes in this value over time as the OS swaps pages in and out of memory.

  • Had this happen to me today. I think CCS didn't like me kicking off a build when it was analyzing a .cfg file. I was working on the message que example

    An out of memory error has occurred. Guess I better read the readme file like it suggests.

  • Heap status is 861M or 1020M today. Clicking on the trash button didn't help. It keeps rising. Its worse when I'm jtag'ing into all 6 cores. The app died at 906M.

    When I rebooted, it stabilized at 207M. After connecting to C6472 LAN emulator, 208M, but then it started walking up to 219, then dropping to 200, and repeating.

    I then built the multicore message queue example. Holding at 219M

    Jumped back to debug perspectice 243M. Dropped back to 219 after 30 sec.

    Loaded cores. Now at 324M. Dropped to 240 after 20 sec

    Ran cores and stopped. 243M

    Started RTOS Analyzer -> Printf and Error Logs 290M

    Clicked on different core in debug window 344M

    Clicked on ROV tab -> LoggerMin 320M

    I've been building and loading, stopping and ROVing for awhile now ~ 322M. 

    Modified .cfg file, saved, and rebuilt  425M (emptying trash didn't help)

    Loaded cores  375M

    I'll try to keep an eye on the heap size so I can tell whats causing it to jump to +800M

  • Hi Eddie,

    I am going to consolidate this post with your other memory leak thread since I think the issues may be related. This will be helpful to have information in one thread.


    ki

  • Hi

    Version: 6.0.0.00190

    I was building a large project. The console said the build was completed. I then changed to the message queue example, edited the cfg, then started its build.

    The build status popup would flash on and off the screen.

    Then came the memory error

    Then came the update monitor error

    And finally after waiting a LONG time, I shut down CCS using the task manager and got

    This has happened before, to prior to this crash, I changed my eclipse.ini to give me more memory (I have 18 GB RAM on my PC)

    -vmargs
    -Xms1024m
    -Xmx1024m

    Here are the logs

    6840.CCSv6Crash.zip

  • Hi Eddie, 

    We took a look at workspace file that you sent and unfortunately, there wasn't much information that we could use. There were some exceptions but it unclear whether they are contributing to high memory usage. We also tried to reproduce high memory usage and eventual crash, but have not run into this issue. I have observed that if I open and then close .cfg file then heap status monitor will appear to show a leak (i.e. heap memory keeps increasing). However, after a few minutes (I have not been able to determine exact time or trigger) that memory seems to be freed up. Even after I close .cfg editor and click on Trash icon to invoke GC, it still does not change much. However, after a few minutes it seems to free up heap to roughly what it was before I opened .cfg file. 

    It maybe difficult to reproduce this on our side. One thing that I can think of that might help is doing a heap dump when you see that high memory usage being shown in heap monitor. There are some tools that can analyze heap dumps and provide more useful information. e.g. which classes/objects have allocated most memory and do analysis if there are candidate memory leaks. 

    Setting this up would take a bit of time, thus I am not sure if this is something that you would be willing to do. I would also need to setup a temporary ftp site as the heap dump file will be roughly the size of your java heap. i.e. much larger than an e-mail or forum post could handle. 

    Please let me know if you can help us tracking this down. 

    Thanks,
    Martin