


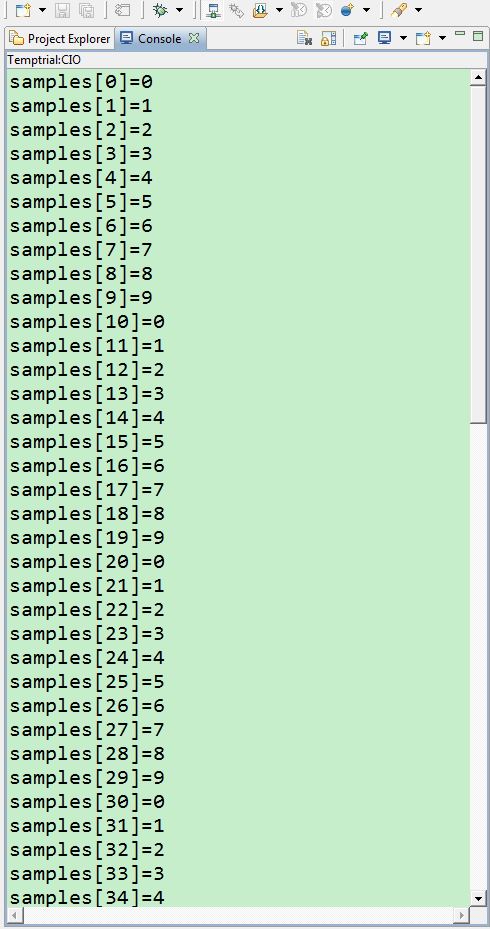
I want to use tool->graph to generate the plot of the array of data containing 8000 samples.
the array is: 0 1 2 .....9 0 1 2 ...9 0 1 2 .....9 .... which is in fact the sawtooth wave.
My biggest problem is choosing appropriate parameters in the graph option:
The problem of choosing parameters:
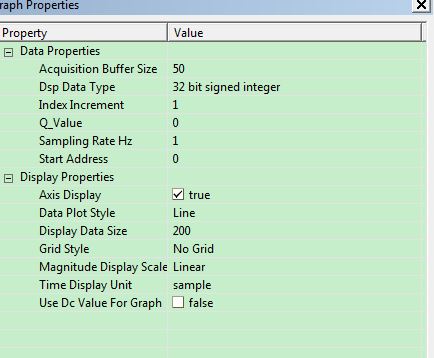
When I choose different sampling rate and acquisition buffer size, why the plots are very different?
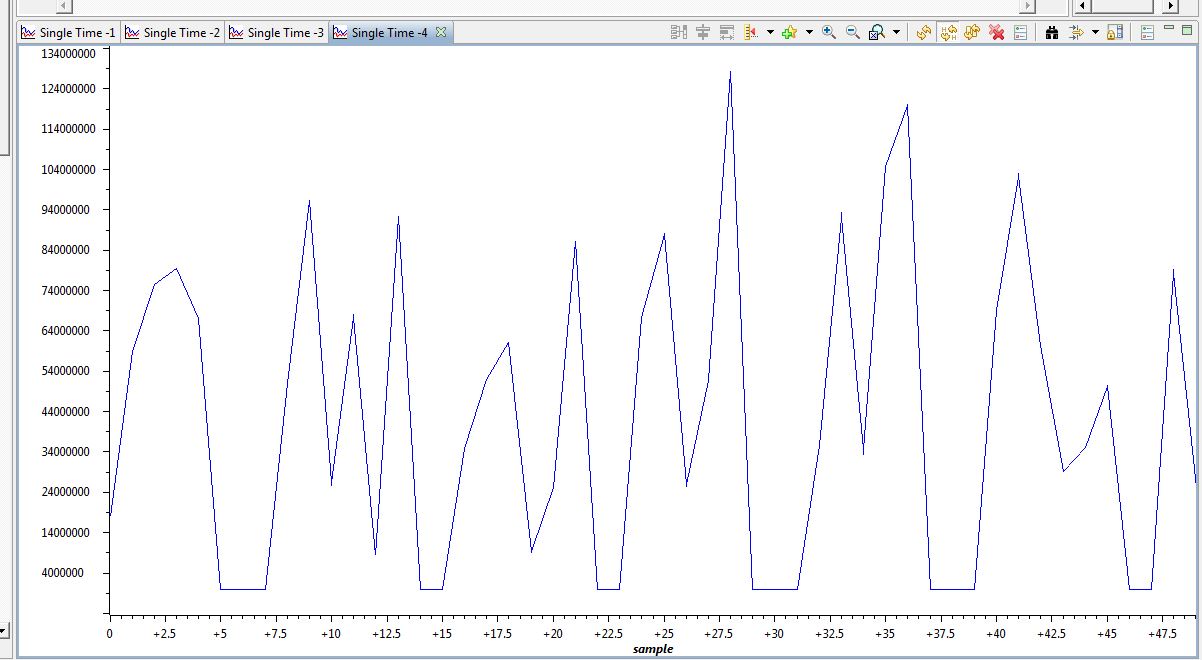
This is when I set the sampling rate as 2hz;
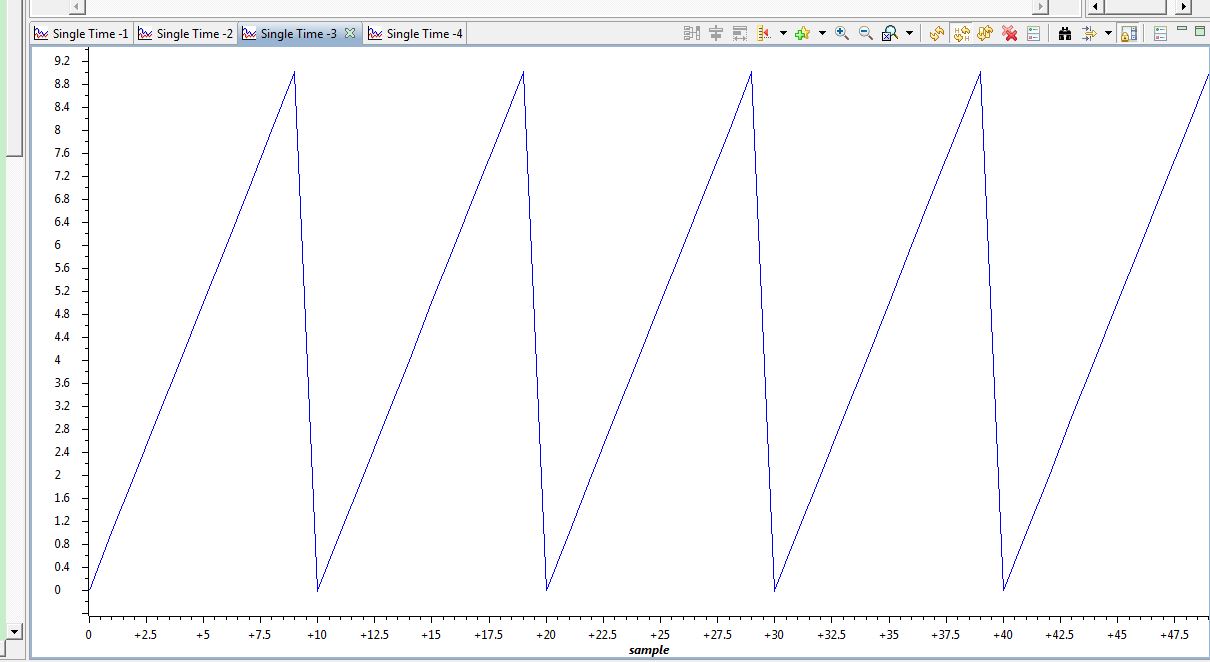
This is the default setting with 1hz sampling rate. And the plot is correct.
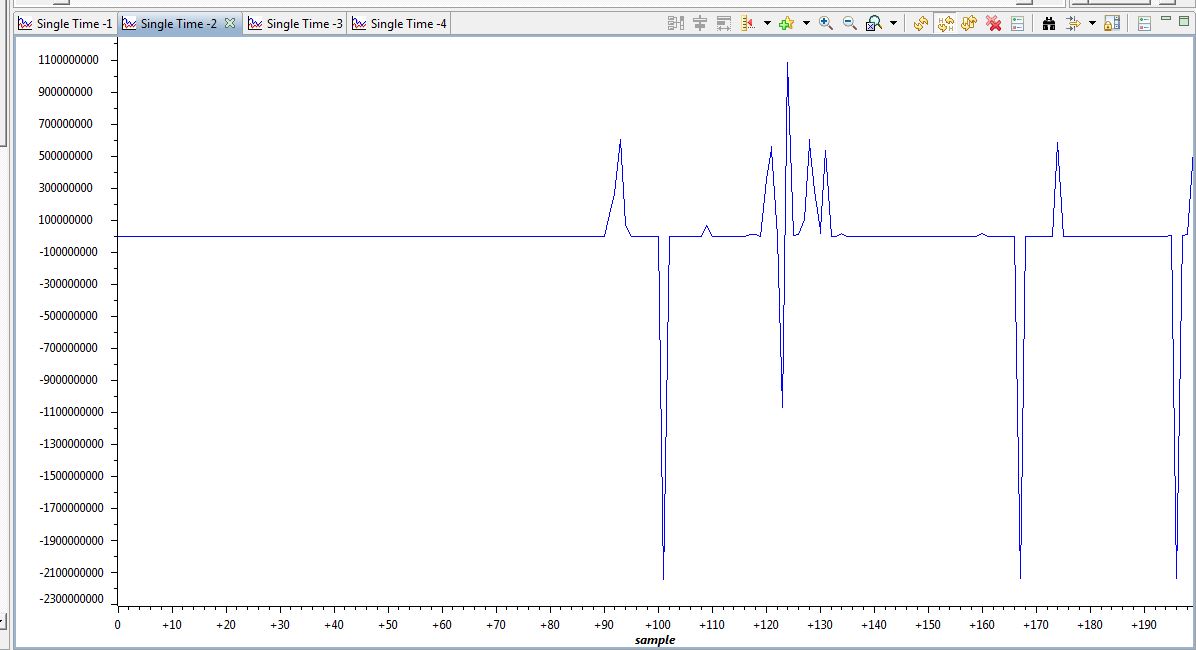
then is the 1hz sampling rate but the 200 acquisition buffer size.
Could you please tell me how to appropriate set the parameters?
Thanks
