


Hello:
I am still not very familiar with the graph settings from tool->graph.
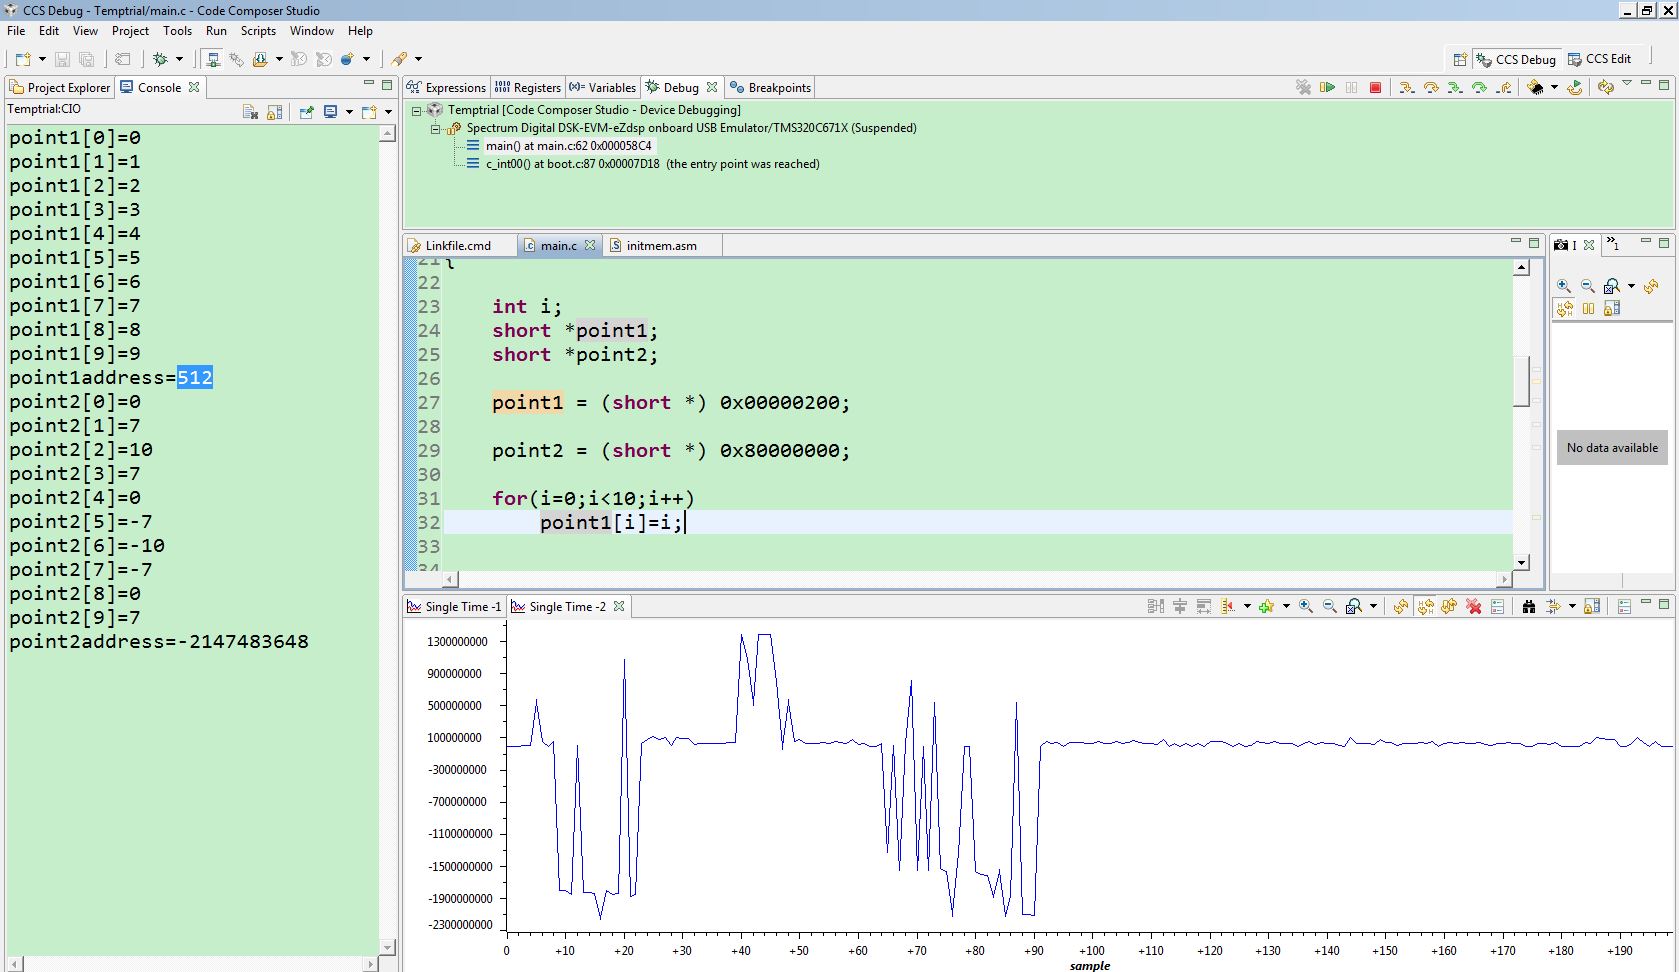
I want to display two arrays of data in the graph, but why the graph always shows me this ugly shape?
Hello:
I am still not very familiar with the graph settings from tool->graph.
I want to display two arrays of data in the graph, but why the graph always shows me this ugly shape?

