This thread has been locked.

If you have a related question, please click the "Ask a related question" button in the top right corner. The newly created question will be automatically linked to this question.

Question about the y-axis value of the graph using graph from "tool"

Hello:

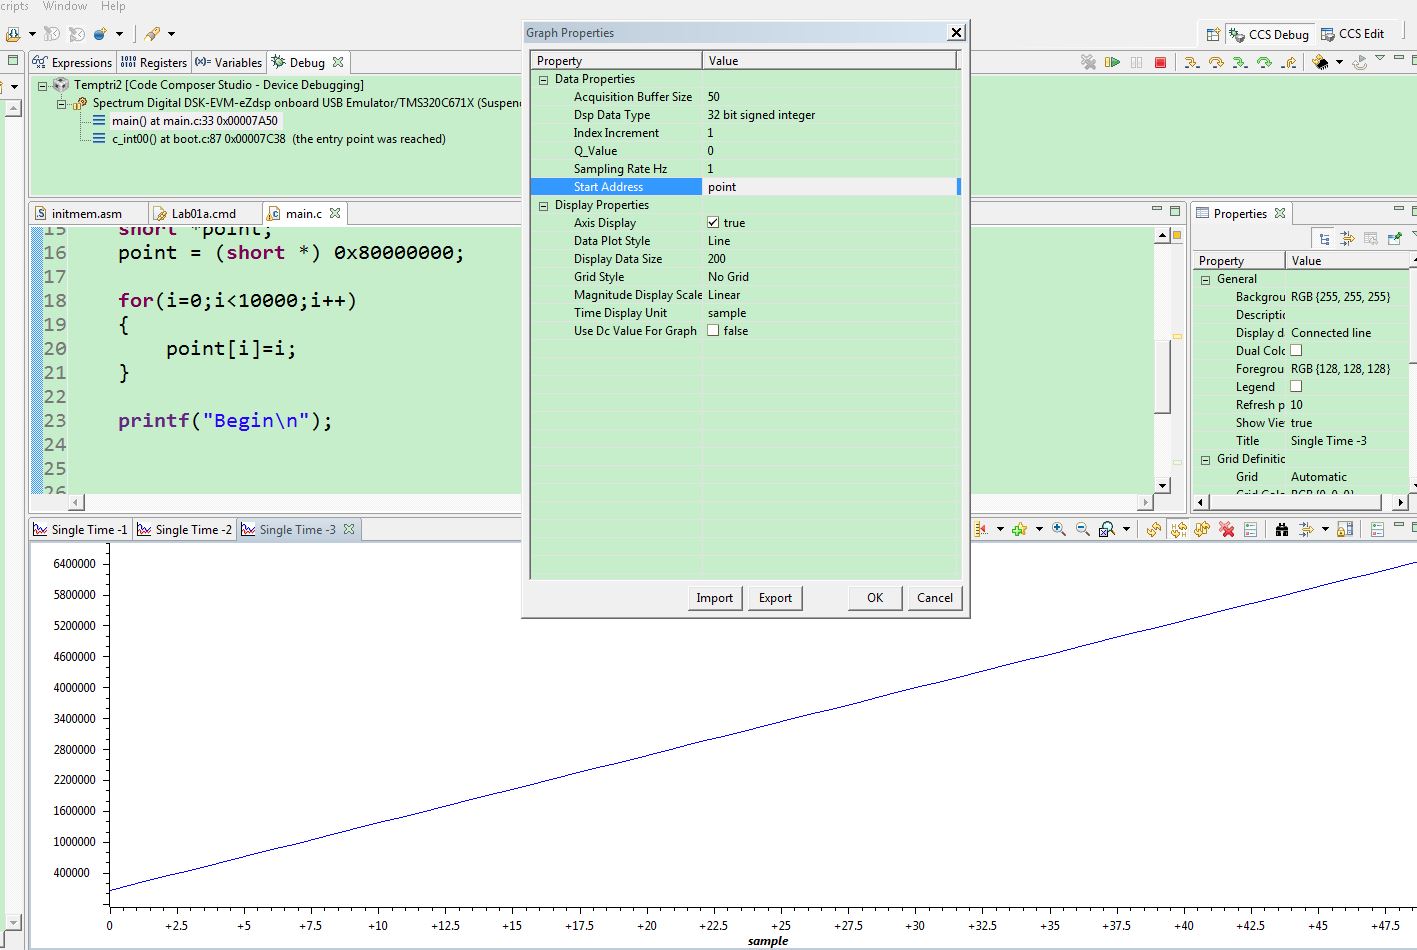
I am using the graph tool to output the array of data containing 10k numbers from 1 to 10000.


Could you please tell me why the y-axis value is not as same as 1-10000. Instead, they are big numbers like 280000?


What sampling rate should I use and do I need to reset the buffer size?
 

  • Hi,

    The Dsp Data Type is different than the size of the variable you defined: point is a signed 16-bit value while the graph is set to display 32-bit signed integers. That may explain why you are getting strange results.

    Sampling rate and buffer size do not influence the values.

    --Cheers