This thread has been locked.

If you have a related question, please click the "Ask a related question" button in the top right corner. The newly created question will be automatically linked to this question.

CCSv5.5 not painting popup windows

CCSv5.5

Windows 7

24G Ram (14.7G available)

C6472 cycle accurate simulator

Java 7 Update 51

Hi

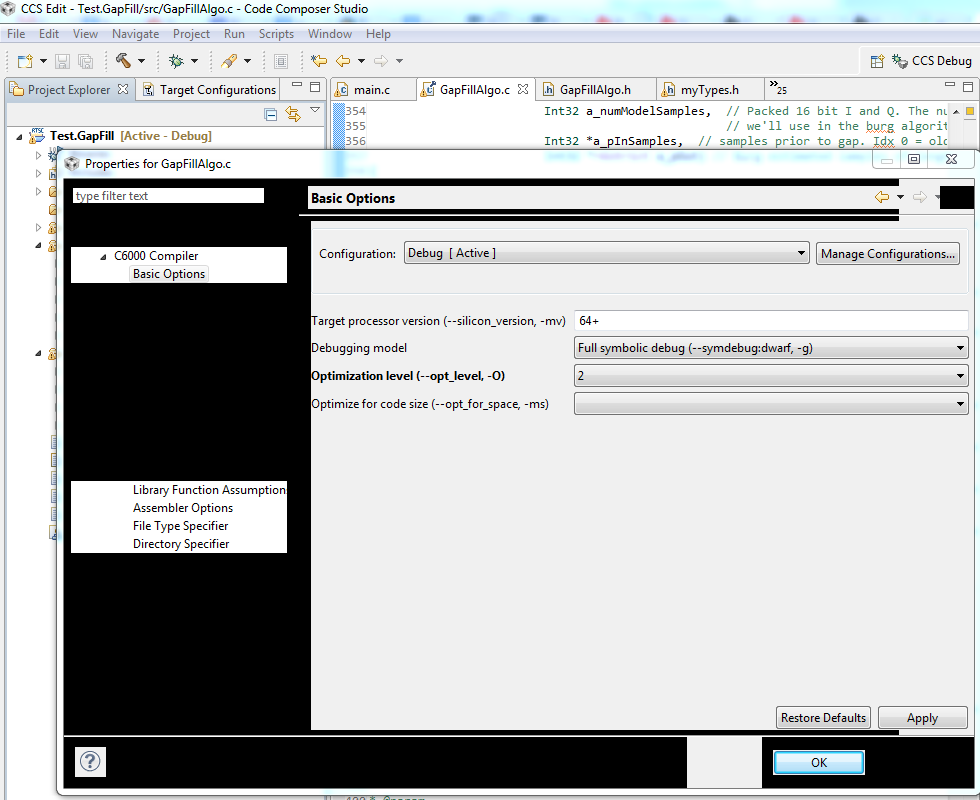
This recently started happening when I started using the simulator. I'm also using the profiler which may or may not be related. The screenshot below shows whats happening. It doesn't take CCS long before it starts misbehaving. I have to restart in order to get it painting properly again.  ;(

The CCS heap is at 101M of 1016M. 

Is there a way to fix this? I typically use the XDS560v2 with an EVM, but I'm doing function optimizations so would like to use the profiler. 

If it is the simulator causing this problem, whats the best way to profile functions with an EVM?

Cheers2u

Eddie
  • Hi Eddie,

    Did you try repairing CCS/installing again ?

    Regards.
    Gautam
  • Yiks, re-installing is a scary thought when it comes to CCS. I may give it a try.

    I've been using the EVM all day today and no screen painting problems (and I've never seen this problem with the EVM prior to using the simulator). So its definitely a bug in either the profiler or the simulator.

    Anyone know the best way to profile code with an EVM? I understand it may be available for the C6472 EVM if you have a XDS560v2 pro (of which I have only the non-pro version)
    http://e2e.ti.com/support/development_tools/code_composer_studio/f/81/t/192022

    I found this info on trace buffer, and it appears the C6472 may have such buffer since the datasheet says its got 6 ETBs (embedded trace buffers). Hopefully I can get the ETB profiling working as the EVM is much faster than the simulator.

    http://processors.wiki.ti.com/index.php/XDS560_Trace

    Anyone know if there is updated info on how to use this with CCSv5.5? The pdf in the above link is for CCS3.3.

    Cheers
    Eddie

  • Update: I found out how to run the EVM ETB trace analyzer. Help -> Help Contents and then search for Trace

    You start it by going to Tools->Hardware Trace Analyzer->Function Profiling

    Seems to work with the Spec Dig XDS560v2 I have. Yay! (fingers crossed that I won't experience painting issues)

    Spec Dig XDS560v2 part #: 512090-0001

    Got this reply from Spec Dig when I asked about upgrading my XDS560v2

    "The XDS560v2 STM and the XDS560v2 Pro Trace are separate products. The XDS560v2 Pro Trace is only sold through Texas Instruments. Information about the Pro Trace product may be seen on the TI Wiki pages at:

    http://processors.wiki.ti.com/index.php/XDS_Pro_Trace

    The XDS560v2 STM (512090-0001) is not upgradeable to the Pro Trace configuration. It has 128 MBytes System Trace buffer storage. More System Trace information may be seen on the TI Wiki pages at:

    http://processors.wiki.ti.com/index.php/XDS560V2 "


    Cheers
    Eddie

  • Eddie - there is also more information on using processor trace in the below training module:
    http://processors.wiki.ti.com/index.php/CCS_Modules_Library#Processor_Trace

    Thanks
    ki
  • Thanks Ki-Soo

    The link to the ppt in the page you posted was very useful
    http://software-dl.ti.com/ccs/esd/training/modules/profiling/CCSv5-Profiling.pptx

    Cheers
    Eddie