This thread has been locked.

If you have a related question, please click the "Ask a related question" button in the top right corner. The newly created question will be automatically linked to this question.

Connect or load program do not show up in menu

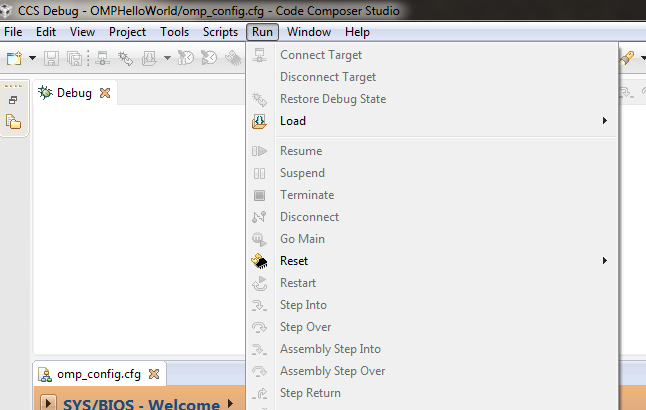
I am using CCSv6 with an XDS560PROTRACE with a EVM6678L.  In the Debug perspective under Run menu, the Connect option is grayed out, as are all the Load options.  Several examples I'm trying to work thru say something like load -> load program ...  but that doesn't seem to be an option.  If I create a debug configuration and launch that, it seems to work.  Why doesn't the Connect menu option show up?

Thanks   Mike

  • Hi Ki,
    Looked at that, and also found the FAQ for CCSv6, but neither seems to address the issue. The v4 FAQ suggests that the Debug View is closed, so the options are greyed out. In v6, the options are under the Run menu, and if the Debug Perspective is not open the Connect and Load submenus don't even show up, much less being greyed out (opening Debug View in CCS Edit perspective does not help). I have opened the Debug Perspective, and the Debug View is definitely open, the menu options show up, but are grey. Maybe I missed it, but didn't see this scenario addressed in the CCSv6 FAQ
    Thanks,
    Mike
  • Mike Stich said:
    In v6, the options are under the Run menu

    Yes the Menu names have since changed. That FAQ is sorely in need of an update which I'll do

    Mike Stich said:
    if the Debug Perspective is not open the Connect and Load submenus don't even show up

    yes, by default the Edit Perspective will not display those options since the Debug perspective is meant to be used for target access commands

    Mike Stich said:
    . I have opened the Debug Perspective, and the Debug View is definitely open, the menu options show up, but are grey.

    Many items should be grey if you have not connected to the target since actions like load program, run, etc require a connect target. However the first menu item under 'Run' is 'Connect Target'. This should be available if a debug session was successfully started. Was a debug session successfully started? If the Debug view is completely blank, the answer is "No'. There should be some content there. If you can post a screenshot of your debug view and the contents of the Run menu, that would be helpful.


    Thanks

    ki

  • The Debug View is completely blank.  How do I get it to show my EVM that I want to connect to?

  • Here is the screen shot I tried to paste in.

  • You need to start a debug session. Simply switching to the CCS Debug perspective does not start a debug session. I assume you have a project and a target configuration file defined to it. If so, all you need to do is select the "debug" button (looks like a little bug) in the CCS Edit perspective. This will launch the debug session for the target. For an example of this, see the below video at around the 4:28 mark:

    Note that because you have multiple cores of the same type on a C6678, you will get a prompt asking your which cores you wish to load the program as show in this link below:

    http://processors.wiki.ti.com/index.php/Multi-Core_Debug_with_CCSv5#Starting_a_Debug_Session

    Thanks

    ki

  • Hi Ki,
    Thanks for the pointers. I guess I was confused on some of the wording of the example instructions, possibly because they are also quite old. I think I got it figured out now.
    Mike