This thread has been locked.

If you have a related question, please click the "Ask a related question" button in the top right corner. The newly created question will be automatically linked to this question.

ccs can not access the memory through xds560v2 pro trace

Other Parts Discussed in Thread: TCI6638K2K

As the title, when I get a varible from the memory, all are 0. why?

  • Could you please provide more details, such as version of CCS, which target device you are using, which memory address you are trying to access etc? Is it the memory view in CCS that is displaying all zeros?

  • Host OS:window XP

    CCS Version: 6.0.1.00040

    target: TCI6638K2K

    debug probe: xds560v2 pro trace

    test steps:

    1.application is running

    2.launch the target configuration

    3. real time mode, succeed to connect the target, for example, core 3

    4.succeed to load the symbol with .out

    5.in the expressions page, fill global varibles,which is in L2 or DDR3

    6.watch the value, all are 0.

  • Hi,

    Although I don't have this particular board to test this, I am almost sure that either:

    1) If there is an application already running on the device, it may be using the MPAX and relocating the physical addresses, thus causing any accesses to return zero.

    2) If there is no application previously loaded, the GEL file is not properly configuring the external DDR memory (if the variables observed are in this memory space)

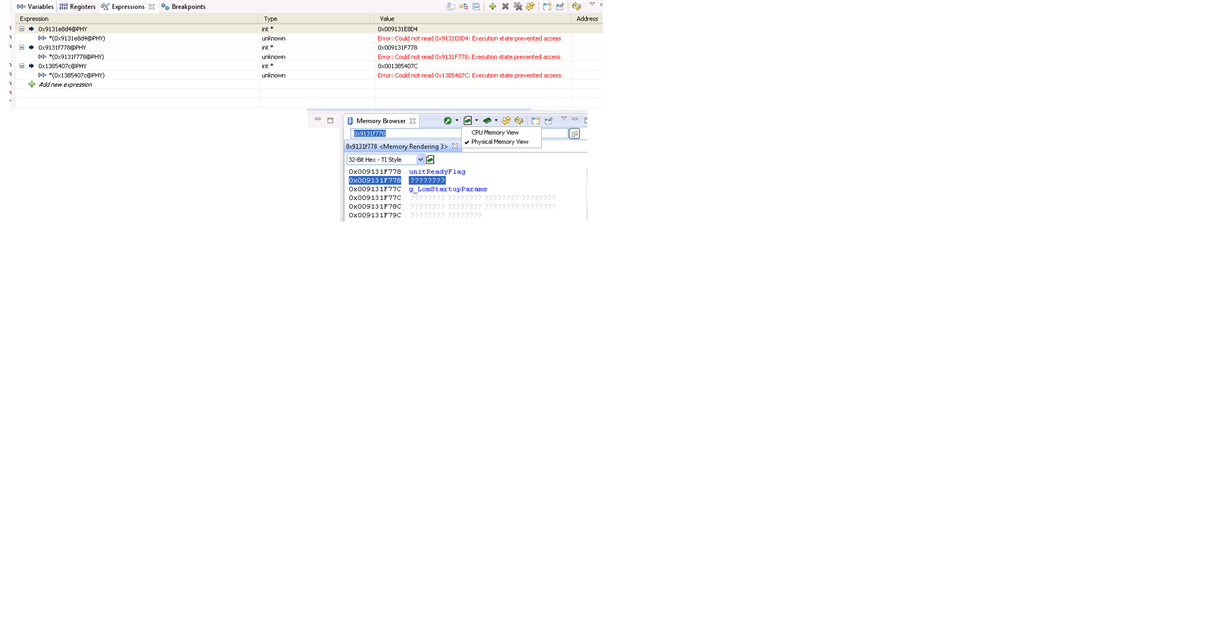
    To check 1) above, you can open the Memory Browser view, type the address and select Physical memory to bypass the MPAX. In the expressions view you can also pass the address followed by the @PHY parameter. For example, if you are looking for 0x80000000, you would type 0x80000000@PHY

    To solve 2) above, simply add a GEL file to your configuration - details here.

    Hope this helps,

    Rafael

  • Hi,Rafael,

    thanks for your answer.

    I'm the condition 1).

    Application is already running.

    With CPU memory view, all are 0.

    With the physical memroy view, it seems not readable.(here for example,  unitReadyFlag is 1 actually)

    (seem the reply can not show the picture, pls see the attachment.)

    It's abormal, right? Is there any way (register) to debug this issue? 

    thanks,

    Zhou Guobiao

  • Zhou,

    If the core is running, you will not be able to see memory unless you either halt the core or enable Real time mode:

    processors.wiki.ti.com/.../Real-Time_Mode

    This is available via two small icons at the Debug view (something shown at the thread below):
    e2e.ti.com/.../233123

    Hope this helps,
    Rafael
  • Hi, Rafael,

    Yes, the target is always connected with real time mode, for we are trying a function profiling test.

    The following snapshot shows the memory accessing from ccs are all 0, while from the our tool they are correct.

    thanks,

    Zhou

  • Zhou,

    I see the Memory Browser is displaying the CPU view and not physical view, which is probably what your application is accessing it. However, just as an additional test can you turn off the L2 cache option and see if that is not getting in the way of a proper display?

    Also, can you post picture of the entire CCS workspace? Basically this will help me see if there is anything obvious missing, be the status of the cores, the status of the real-time mode, etc.

    Regards,

    Rafael