Hello ,
This morning I did an update of the code composer studio.
The current version is 6.1.0.00104 installed on a 64bit Windows7.
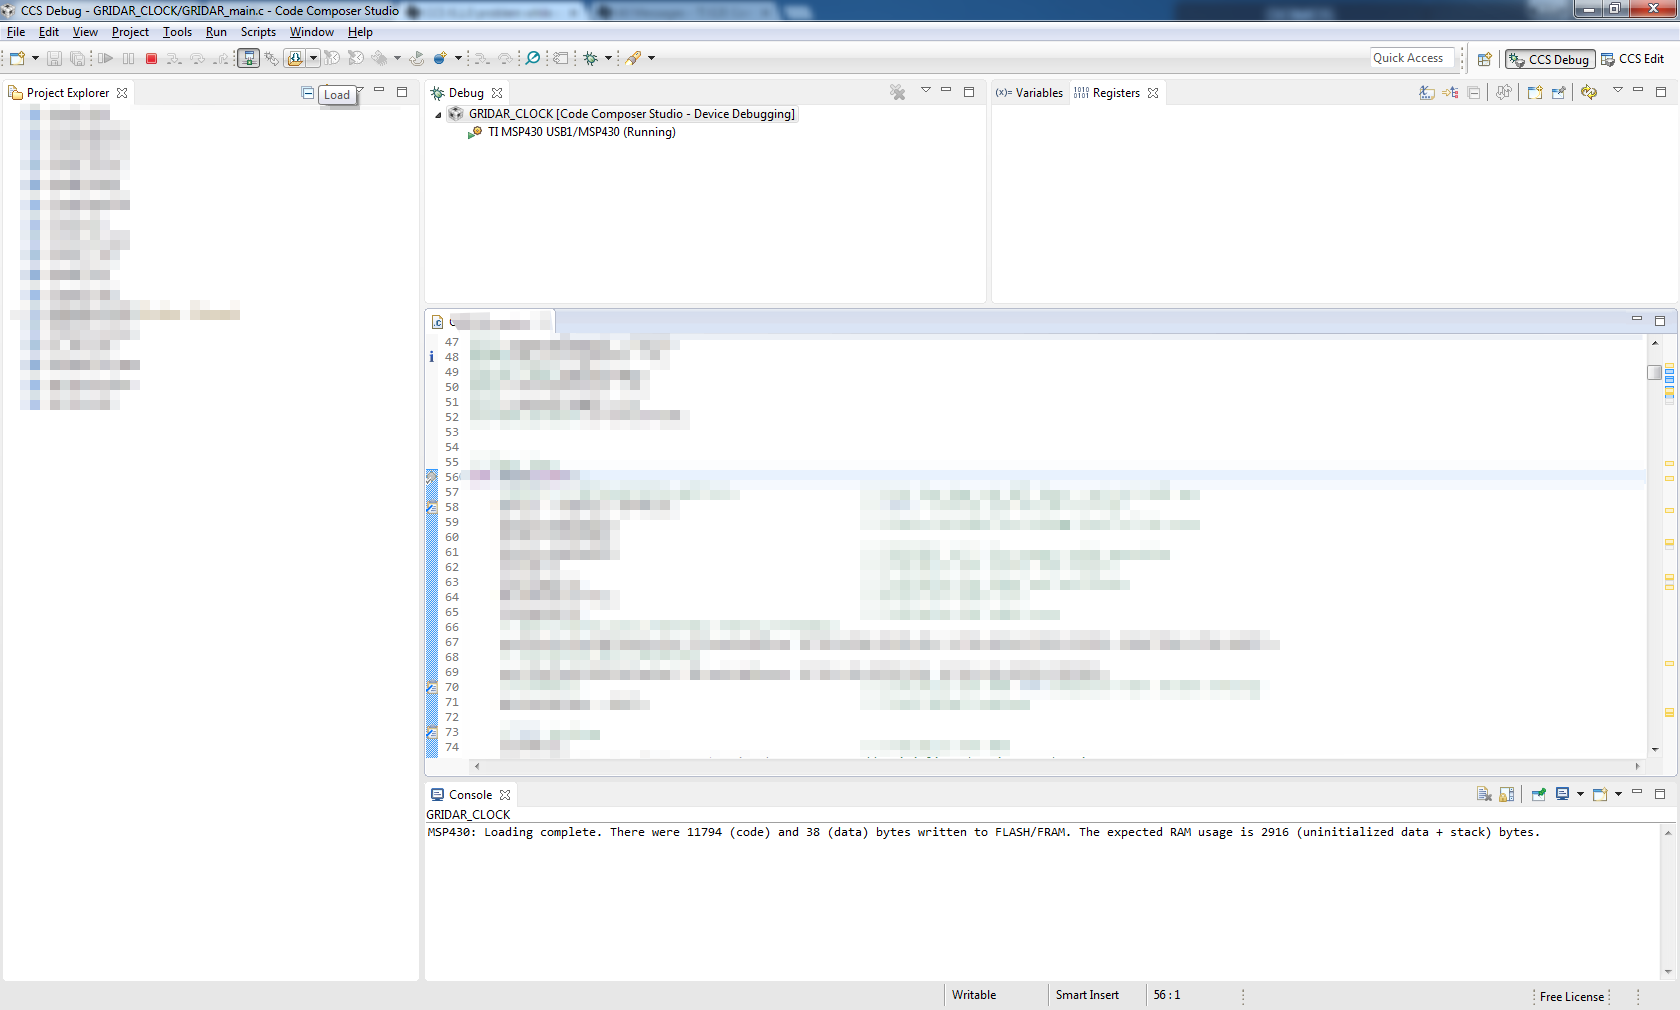
When i try to debug my project the debugging session launches and the only button visible is the terminate button.
When I disable the autorun to main option, the debugging sesion works just fine (I can run and pause it).
But when the autorun to main option is enabled I can only terminate the session and not start it.
This wasn't a problem before the upgrade this morning.
Does anyone have an idea what causes the problem?
With kind regards,
Wim