Hi,
There are a few terms/definitions we cannot find in TI documents or web.
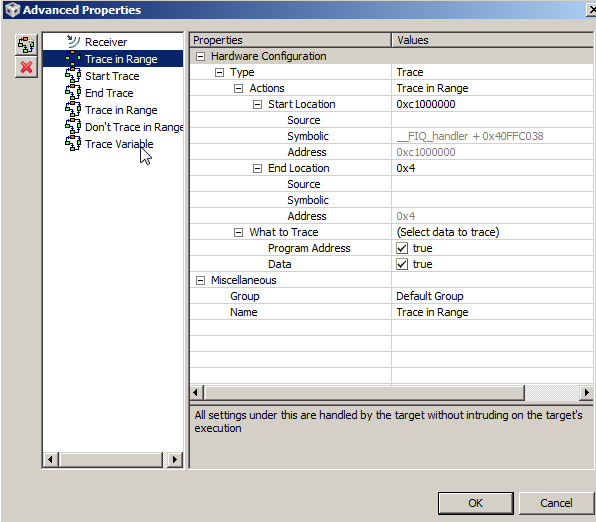
For tracing an omapl138 chip using ETB,
Questions without answer:
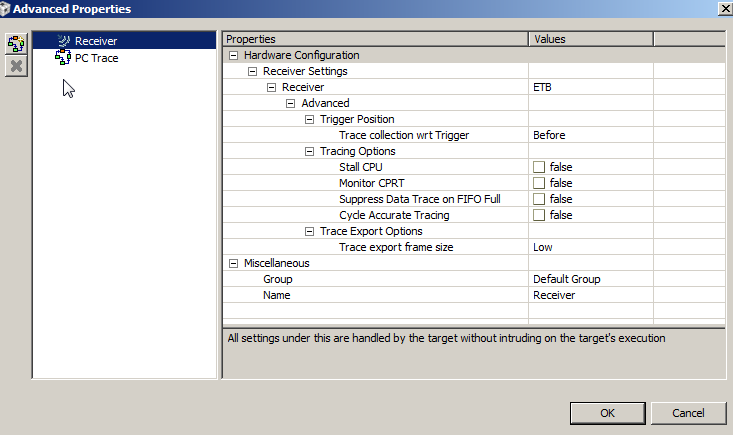
- “wrt” in “Trace Condition wrt trigger”, what is “wrt”? Maybe it is a short for something?
- The pull-down menu: what does “before”, “after” and “about” mean? Say if we run to a breakpoint, the basic understanding is that ETB is going to collect PC during the last run in its circular buffer, so perhaps it is more close to “(immediately) before”? Then what about the other two options?
- CPRT and “monitor CPRT” is also undocumented.
Questions with probable answer:
- “Suppress Data on FIFO full”. I guess this is equivalent to the old “circular” option as (1.2.1 Stop on buffer full and 1.2.2 Circular buffer)
- “Stall CPU”, likely as1.1 ETB Trace System Control.
- “Cycle Accurate Tracing”, likely 8.1 Cycle Accurate Trace Profiling with CCS Examples
Please advise us with the primarily the unknown questions, and confirm the remaining.
Lencho