This thread has been locked.

If you have a related question, please click the "Ask a related question" button in the top right corner. The newly created question will be automatically linked to this question.

Trace Viewer showing incorrect Funtion when using PC trace

Other Parts Discussed in Thread: AM3352

Hi,

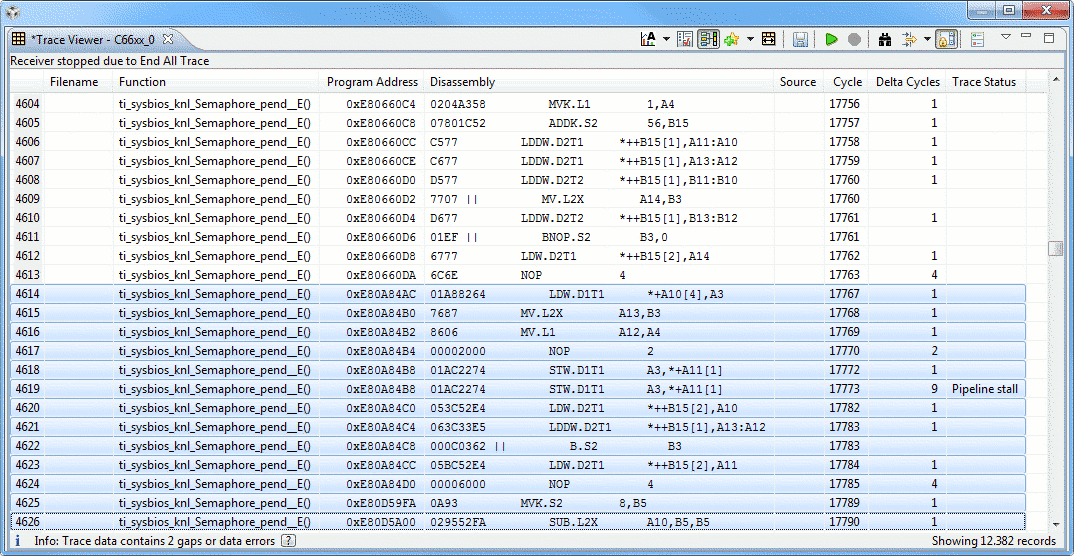
I'm trying to use PC trace in CCSv6.1 on a C6678 device. The problem is that the Trace Viewer often shows incorrect entries in the Funtion column. It seems that the function entries don't get updated when a branch to a different funtion occurs.

Here is an example:

The function Semaphore_pend__E() is returning at line 4614 to the calling function. But the Function colunn remains the same.

Any help is appreciated,
Ralf

  • Ralf Goebel said:
    I'm trying to use PC trace in CCSv6.1 on a C6678 device. The problem is that the Trace Viewer often shows incorrect entries in the Funtion column.

    I have seen the same problem when using PC trace in CCS 6.1 on a AM3352 ARM Cortex-A8, connected with a Blackhawk USB560-M.

    The Program Address column is correct and does change when a branch occurs to a different function. The issue appears to be that the resolution of the program address to function doesn't always work for the Trace Viewer. As a work-around the program address hex value can be entered in the Disassembly view which is then able to show which function the address is in.

    As an example:

    In the trace viewer lines 4242 to 4244 the Function is correctly shown as CP15Ttb0Set.

    At trace viewer line 4245 the Program Address 0x40305064 is incorrectly reported as still CP15Ttb0Set, yet the Disassembly view correctly shows that Program Address 0x40305064 is in the MMUEnable function (on the instruction following the call to CP15Ttb0Set).

  • Could someone at TI please take a look at this issue?

    Thanks,
    Ralf