This thread has been locked.

If you have a related question, please click the "Ask a related question" button in the top right corner. The newly created question will be automatically linked to this question.

Code composer version 6 with debugging


Dear All;

I have a code composer "Version: 6.1.0.00104 "

I write my own code and i successfully compiled the code. and when i tried to debug my code, i got this message

MSP430: Error initializing emulator: Tried to initialize USB FET number 3, but only found 1 USB FETs

I can't know what i can do to solve this issue

Note:

  • My TI debugger " MSP430 USB-debuger-Interface", MSP-FET430UIF  is working probably with the IAR and every this is OK
  • I can read the debuger Firmware version is 2.04.09.001
  • The MSP-FET430UIF was installed as a VCP port
  • I update the firmware to version 3 , and the result was the same
  • I upgrade the Debuger Firmware version to be 3.02.03.009 with the same result
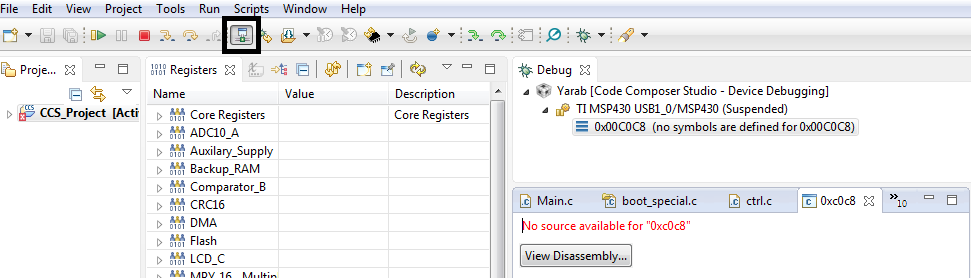
  • I also upgrade the debuger to the last firmware version as in the picture below, and the result is as the same

I appreciate your fast reply, and thanks for your support

Best regards

Mohamed Hamed


  • Hi,

    Did you search the forum for similar queries? There are number of resolved posts on the same issue.
    www.google.co.in/

    Regards,
    Gautam
  • Hi,

    thanks you for your support

    I already searched the Google and i didn't find any answer,

    I made another debug profile , and i changed the USB port to be USB port1<default>, although the USB is not USB 1, it is actually Port 2,

    So now i successfully connected to the target and i can debug , but i have another problem.

    The problem is as follow:

    1- When i pressed the debug button, the code does not go to the main ( start point), i have to follow these steps to can start from main

       -

    -------------------------------------------------------------------------------------------------------------------

    So is thier any way to let the debuger start to point the main directly.

  • Mohamed Hamed said:
    When i pressed the debug button, the code does not go to the main ( start point), i have to follow these steps to can start from main

    You probably clicked the Debug button with the Target Configuration file open in the Target Configuration editor and in focus. This is a way to manually launch the debugger.

    To perform those steps automatically, make sure the project is in focus when clicking the Debug button. 

    See this wiki for more details: http://processors.wiki.ti.com/index.php/Debug_Handbook_for_CCS#Launching_Debugger