This thread has been locked.

If you have a related question, please click the "Ask a related question" button in the top right corner. The newly created question will be automatically linked to this question.

Hardware Analyzer feature with XDS 200 debug probe

Other Parts Discussed in Thread: TM4C129XNCZAD, TM4C1292NCPDT

Hi,

I would like to measure the performance of the real time application running on TIVA C series (Tiva TM4C129XNCZAD and Tiva TM4C1292NCPDT) using the XDS 200 debug probe.

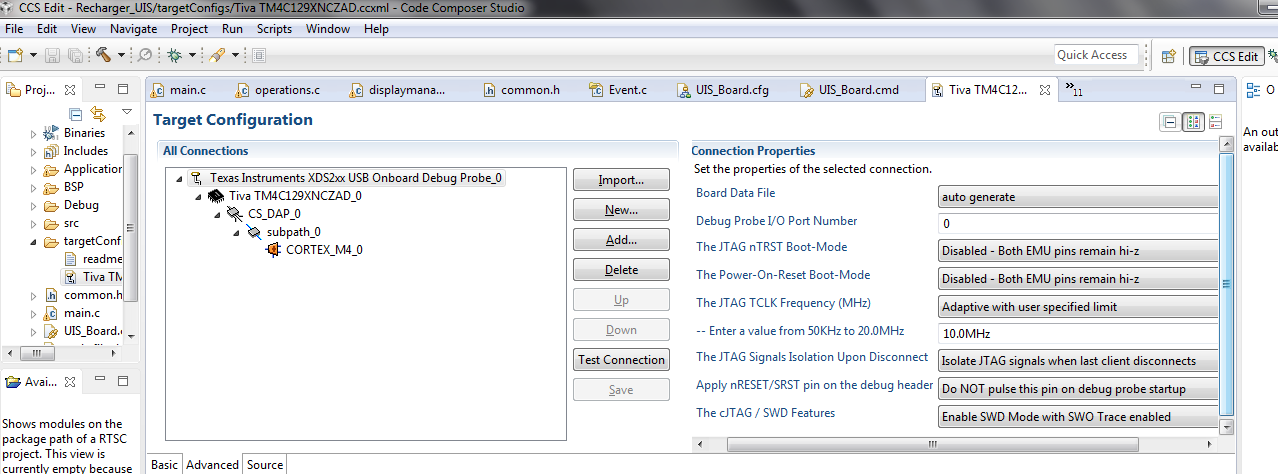
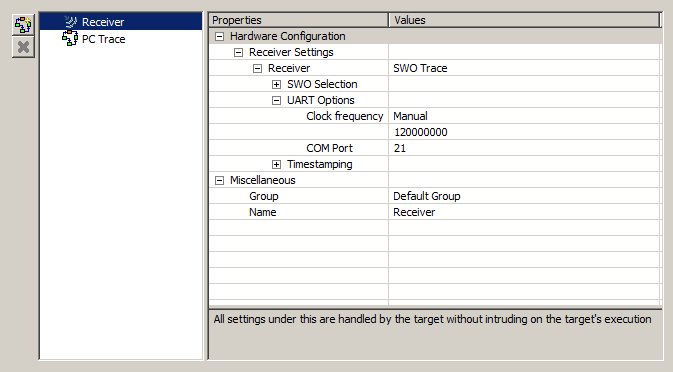
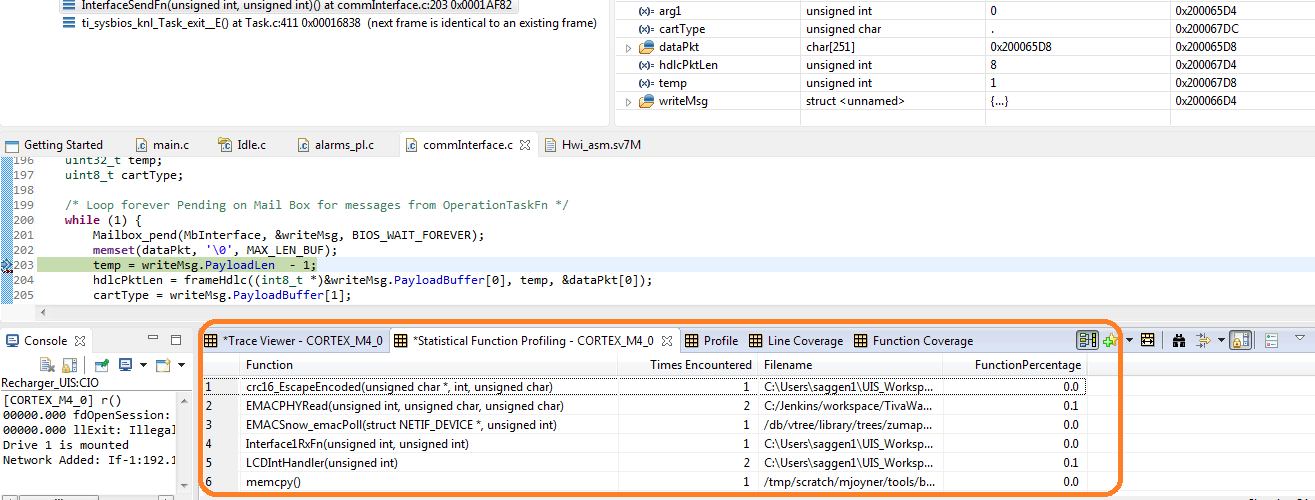
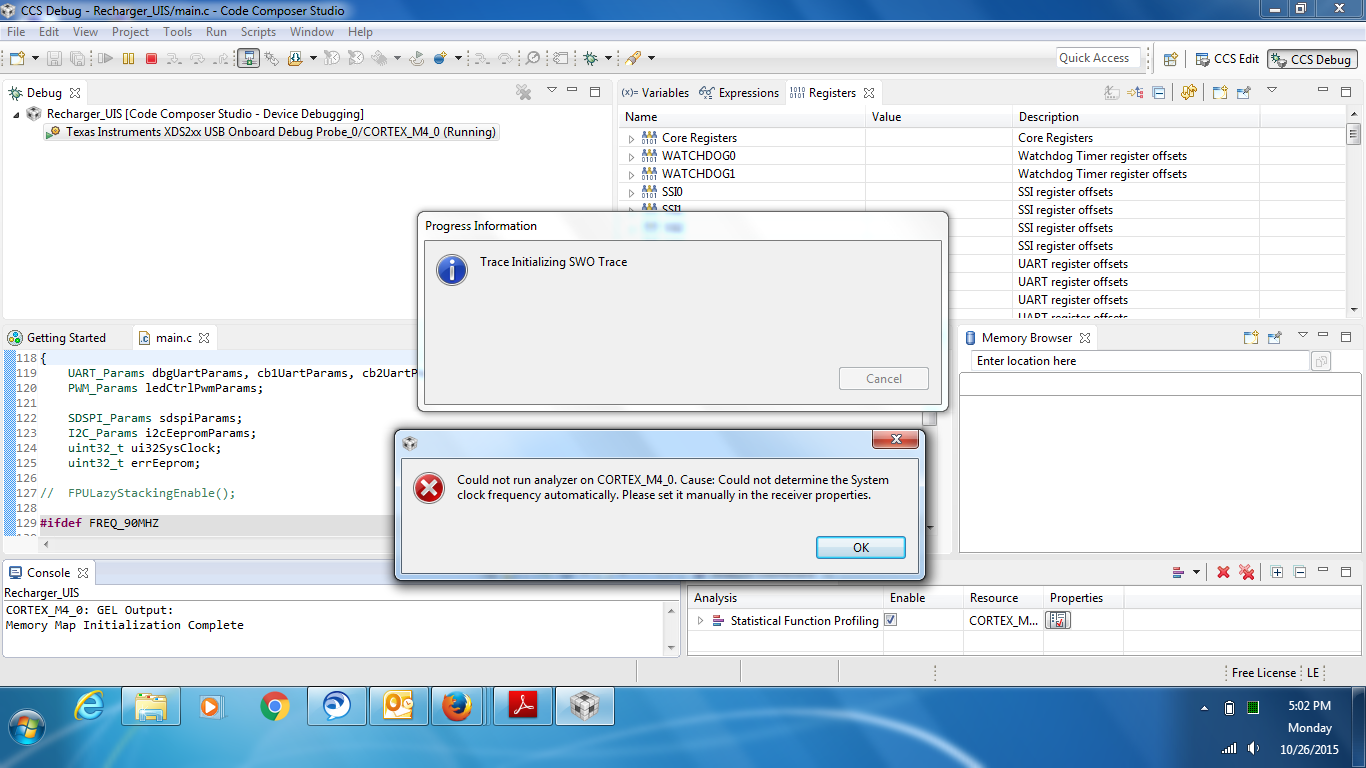
I have configured the target configuration file to enable the SWO trace and then when i tried monitoring the static function profiler, either the CCS crashes or it gives the following error.

Refer snapshot below:

Request your help to fix this issue.

Also could you please let me know the difference between, system analyzer, RTSC analyzer and hardware analyzer options available in CCS 6.1

Thanks,

-Nikhilesh

  • Statistical function profiling should work on Tiva C with XDS200 emulator. I will give it a try tomorrow with my Launchpad and report back.

    Nikhilesh Saggere said:
    Also could you please let me know the difference between, system analyzer, RTSC analyzer and hardware analyzer options available in CCS 6.1

    Please see the System Analyzer Users Guide, it explains what falls under RTOS Analyzer and System Analyzer.
    For Hardware Trace Analyzer, please see its Users Guide. It explains what it is used for, and which devices/emulators are supported.

  • I tried using the Statistical Function Profiling feature with CCS 6.1.1 and TM4C1294 Connected LaunchPad, but was unsuccessful. My CCS did not hang/crash or generate the error message you reported, and I was able to open the Statistical Function Profiling, Interrupt Profiling etc. views without issues, however there was no data displayed. I will report this to the trace team so they can take a deeper look and fix the issue. I apologize for the inconvenience, but unfortunately it appears that there are currently a few issues with ITM trace on Tiva C using XDS200.

  • Thanks for the update AartiG!

    I had configured the XDS debugger with the following settings, i tried again to monitor the same the CCS is either crashing or displaying the above shown error to set the frequency manually. (please let me know if there is anything incorrect in these setting which might be causing the issue)

    Would wait for your reply to fix this issue.

  • I'm not sure what may be happening here as I did not observe crashes or these error messages when using CCS 6.1.1, external XDS200 emulator and TM4C1294 LaunchPad. 

    What is the exact version of CCS you are using? 
    I assume you are working with a custom board with an onboard XDS200 rather than an external XDS200, is that correct?
    One thing to check is that your XDS200 firmware is up-to-date. Please see the readme.txt in \ccsv6\ccs_base\emulation\specdig\xds2xx for details on how to update firmware.

    Even if we were to get past this error, I still think that ITM trace is currently not fully functional with latest CCS. The emulation team will be looking into this, and we will keep you informed when there is an update. In the meantime, you can revert the cJTAG/SWD Features to default setting and perform normal debugging, just not be able to use ITM trace unfortunately.

  • Hi,

    Here is the exact version of CCS that i am using "Version: 6.1.1.00022"

    And yes i am working on the custom board with the following build options.

    "Connection: Texas Instruments XDS2xx USB Onboard Debug Probe" (as shown below)


    But i am connecting the XDS debug probe externally via the 20 pin -Jtag port, does it mean i have to select other option under "Connection"?

    Also i don't find the said folder in the CCS installation base: (Refer snapshot below, i only have the following)

    Could this be an issue? don't have clue how do i update the firmware now.

    Please let me know your thoughts.

    Thanks,

    -Nikhilesh

  • Nikhilesh Saggere said:
    But i am connecting the XDS debug probe externally via the 20 pin -Jtag port, does it mean i have to select other option under "Connection"?

    Yes, if using the external XDS200 emulator, you should instead choose "Texas Instruments XDS2xx USB Debug Probe". 

    Nikhilesh Saggere said:

    Also i don't find the said folder in the CCS installation base: (Refer snapshot below, i only have the following)

    Could this be an issue? don't have clue how do i update the firmware now.

    You are missing the support for Spectrum Digital emulators, which you need to install first before you can update the firmware. Please follow the steps below:

    1) To install Spectrum Digital support, re-run the main CCS installer, choose the installation location to be the same as where your current CCS is installed, and check the box for Spectrum Digital Debug Probes to add support for it.

    2) After install is complete, start up CCS, go to menu Help->Installation Details, and check the version listed there for Spectrum Digital Emulators. If it is 5.2.0.12, then the next step is to update it to a newer version. Go to menu Help->Check for Updates. Click on "De-select All" and then select only Spectrum Digital Emulators. Follow the steps to complete the update.

    3) Restart CCS after update, go to menu Help->Installation Details, and verify that version listed for Spectrum Digital Emulators is now 5.2.0.13.

    4) Run the XDS200 firmware update. See this wiki, or the readme.txt file in \ccsv6\ccs_base\emulation\specdig\xds2xx.
    After running the update, the firmware should be v1.0.0.6.

    5) Now you should be able to use ITM trace. One thing to note: when configuring Trace Analyzer, go to Advanced Settings and check what the Clock Frequency is set to. Mine is set to Manual, 120MHz (per screenshot below), and works well with my TM4C1294 LaunchPad. You could try this setting, or alternately, start the trace after the application has configured the system clock (ie, set a breakpoint after the line in your code that sets the system clock, run, halt at the breakpoint and then start trace).


  • Thank you AartiG for the detailed information.

    I have followed the above said steps, now am seeing a different error. (error enabling this function for CORTEX_M40: as shown below)

    Settings and firmware versions are intact with what you had mentioned.

    Thanks,

    -Nikhilesh

  • Make sure the target is halted (not running) when you start the Hardware Trace Analyzer.

  • I have  put a breakpoint to halt the target, but when the hardware trace analyzer is run, the profiler is not showing any data (refer snapshot below)

    I think we this we are back to the main issue:

  • Nikhilesh,

    I can't really explain why you still don't see any trace data. These settings/steps work for me on a TM4C1294 Launchpad and CCS 6.1.1 using example projects from TivaWare. I assume you have followed the general guidelines and steps in sequence:
    Load the application to target, set a breakpoint after the line in your code that configures the system clock, run to breakpoint, start the Trace/Statistical Function Profiling from the menu Tools->Hardware Trace Analyzer, run your program and halt again to view trace data.

  • Nikhilesh,

    Just adding to Aarti's response, given you had several configurations and connections I would perhaps try to start fresh:

    - Close CCS

    - Visit the Troubleshooting CCSv6 page and check section 4 - more specifically item 5 that talks about Trace.

    - At the same page at section 3 item 3, I would also start with a fresh workspace just to clear out anything else that could be getting in the way.

    - Also, before launching the target I would double-check if the standalone XDS200 debug probe is selected, as well as the SWD with SWO Trace enabled.

    - I would also reduce the JTAG TCLK speed just to be sure the PCB routing is not creating too much interference. 

    - At last, I would try the same setup but in a development kit - this would rule out any possible HW problems.

    Just like Aarti, my setup here works fine with two TM4C129 development kits.

    Hope this helps,

    Rafael

  • Thank you Rafel and Aarti.
    I shall re-try with the said recommendations and post you the update.
  • Thank you Rafel and Aarti; i am able to see some data in trace analyzer window as shown below (when using statistical function profiling) :

    i have put a breakpoint in a function called InterfaceSendFn, and everytime the control halts at this breakpoint i get to see the data.

    But i am unable to make sense out of the gathered information, is it going to pull the data for all the functions that were executed during the time interval between the execution to halt at breakpoint ?

    Want to understand how it is displaying the data and how to interpret this information. (am trying to see some other functions present in code, for which the data is not at all displayed)

    please help me in this regard.

    Thanks,

    -Nikhilesh

  • Nikhilesh Saggere said:
    Want to understand how it is displaying the data and how to interpret this information.

    Please see the Trace Analyzer Users Guide, and search for 'Statistical Function".