This thread has been locked.

If you have a related question, please click the "Ask a related question" button in the top right corner. The newly created question will be automatically linked to this question.

Remove HW breakpoint on CCS V5

Other Parts Discussed in Thread: TMS320C5535

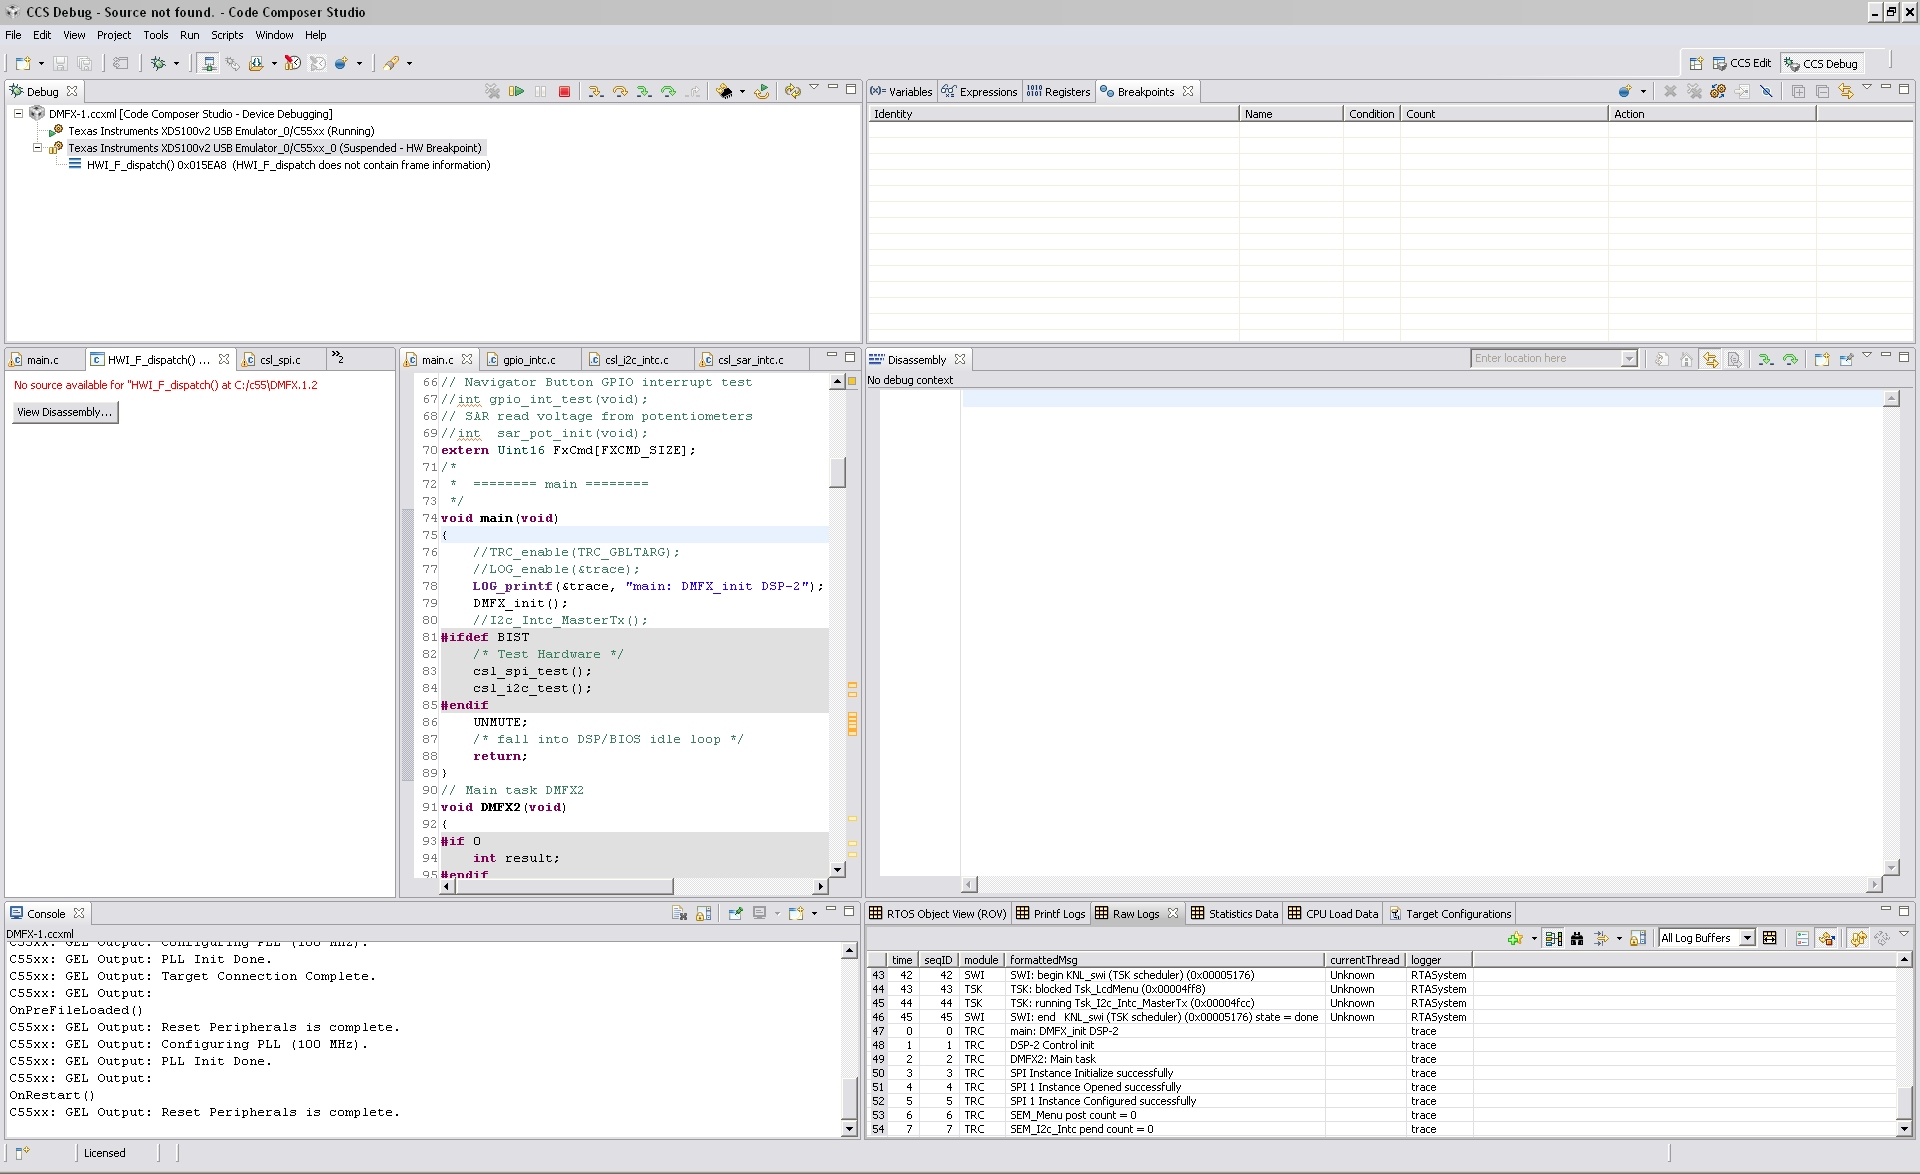
On Code Composer v5 somehow I succeeded to inadvertently set a HW breakpoint on HWI_F_dispatch function, even though breakpoints list is void and all breakpoints removed.

Every time that I run my program it stops in the middle of this function saying Suspended HW breakpoint. I removed all breakpoints but the program still stops at the same point.

Any idea on how to remove this HW breakpoint? My application has become un-debuggable, please help.

  • Hello,
    It could be that the debugger lost track of this breakpoint/watchpoint somehow, hence it is not aware of it. Did you try closing CCS and power cycling the target?

    Thanks
    ki
  • That doesn't seem to work. I would not like to reinstall CCS v5. There must be a way to remove that HW breakpoint. Any ideas?
  • Please open the Scripting Console and type:

    js:> eval("DEBUG_DumpBreakpoints()")

    and cut and paste the output that appears in the Console view to this thread

    Thanks

    ki

  • The program is Suspended with HW breakpoint at HWI_F_dispatch() 0x182E4 and the dump after running eval("DEBUG_DumpBreakpoints()") is the following:

    C55xx_0: Breakpoint Manager Dump: Total Allocated Logical Breakpoints: 8

    C55xx_0: Breakpoint Manager Dump: Total Allocated Software Physical Breakpoints: 10

    C55xx_0: Breakpoint Manager Dump: Total Allocated Legacy Hardware Physical Breakpoints: 0

    C55xx_0: Breakpoint Manager Dump: Total Allocated 55 Hardware Physical Breakpoints: 2

    C55xx_0: Breakpoint Manager Dump: Total Allocated Thread Physical Breakpoints: 0

    C55xx_0: Breakpoint Manager Dump:

    C55xx_0: Breakpoint Manager Dump: Enabled: 1

    C55xx_0: Breakpoint Manager Dump:

    C55xx_0: Breakpoint Manager Dump: Hardware Configuration

    C55xx_0: Breakpoint Manager Dump: Location: "C$$EXIT" (0x15782)

    C55xx_0: Breakpoint Manager Dump: Debugger Response

    C55xx_0: Breakpoint Manager Dump: Condition:

    C55xx_0: Breakpoint Manager Dump: Skip Count: 0

    C55xx_0: Breakpoint Manager Dump: Current Count: 0

    C55xx_0: Breakpoint Manager Dump: Action: Terminate Program Execution

    C55xx_0: Breakpoint Manager Dump: Miscellaneous

    C55xx_0: Breakpoint Manager Dump: Group: Default Group

    C55xx_0: Breakpoint Manager Dump: Name:

    C55xx_0: Breakpoint Manager Dump: Breakpoint set by the system

    C55xx_0: Breakpoint Manager Dump:

    C55xx_0: Breakpoint Manager Dump: Disabled: 3

    C55xx_0: Breakpoint Manager Dump:

    C55xx_0: Breakpoint Manager Dump: Hardware Configuration

    C55xx_0: Breakpoint Manager Dump: Location: "C$$EXITE"

    C55xx_0: Breakpoint Manager Dump: Debugger Response

    C55xx_0: Breakpoint Manager Dump: Condition:

    C55xx_0: Breakpoint Manager Dump: Skip Count: 0

    C55xx_0: Breakpoint Manager Dump: Current Count: 0

    C55xx_0: Breakpoint Manager Dump: Action: Terminate Program Execution

    C55xx_0: Breakpoint Manager Dump: Miscellaneous

    C55xx_0: Breakpoint Manager Dump: Group: Default Group

    C55xx_0: Breakpoint Manager Dump: Name:

    C55xx_0: Breakpoint Manager Dump: Breakpoint set by the system

    C55xx_0: Breakpoint Manager Dump:

    C55xx_0: Breakpoint Manager Dump: Hardware Configuration

    C55xx_0: Breakpoint Manager Dump: Location: "C$$IO$$"

    C55xx_0: Breakpoint Manager Dump: Debugger Response

    C55xx_0: Breakpoint Manager Dump: Condition:

    C55xx_0: Breakpoint Manager Dump: Skip Count: 0

    C55xx_0: Breakpoint Manager Dump: Current Count: 0

    C55xx_0: Breakpoint Manager Dump: Action: Process CIO

    C55xx_0: Breakpoint Manager Dump: Miscellaneous

    C55xx_0: Breakpoint Manager Dump: Group: Default Group

    C55xx_0: Breakpoint Manager Dump: Name:

    C55xx_0: Breakpoint Manager Dump: Breakpoint set by the system

    C55xx_0: Breakpoint Manager Dump:

    C55xx_0: Breakpoint Manager Dump: Hardware Configuration

    C55xx_0: Breakpoint Manager Dump: Location: "C$$IOE$$"

    C55xx_0: Breakpoint Manager Dump: Debugger Response

    C55xx_0: Breakpoint Manager Dump: Condition:

    C55xx_0: Breakpoint Manager Dump: Skip Count: 0

    C55xx_0: Breakpoint Manager Dump: Current Count: 0

    C55xx_0: Breakpoint Manager Dump: Action: Process CIO

    C55xx_0: Breakpoint Manager Dump: Miscellaneous

    C55xx_0: Breakpoint Manager Dump: Group: Default Group

    C55xx_0: Breakpoint Manager Dump: Name:

    C55xx_0: Breakpoint Manager Dump: Breakpoint set by the system
  • The result of the dump on the other processor that keeps running is the following:
    C55xx: Breakpoint Manager Dump: Total Allocated Logical Breakpoints: 8

    C55xx: Breakpoint Manager Dump: Total Allocated Software Physical Breakpoints: 10

    C55xx: Breakpoint Manager Dump: Total Allocated Legacy Hardware Physical Breakpoints: 0

    C55xx: Breakpoint Manager Dump: Total Allocated 55 Hardware Physical Breakpoints: 2

    C55xx: Breakpoint Manager Dump: Total Allocated Thread Physical Breakpoints: 0

    C55xx: Breakpoint Manager Dump:

    C55xx: Breakpoint Manager Dump: Enabled: 1

    C55xx: Breakpoint Manager Dump:

    C55xx: Breakpoint Manager Dump: Hardware Configuration

    C55xx: Breakpoint Manager Dump: Location: "C$$EXIT" (0x187d9)

    C55xx: Breakpoint Manager Dump: Debugger Response

    C55xx: Breakpoint Manager Dump: Condition:

    C55xx: Breakpoint Manager Dump: Skip Count: 0

    C55xx: Breakpoint Manager Dump: Current Count: 0

    C55xx: Breakpoint Manager Dump: Action: Terminate Program Execution

    C55xx: Breakpoint Manager Dump: Miscellaneous

    C55xx: Breakpoint Manager Dump: Group: Default Group

    C55xx: Breakpoint Manager Dump: Name:

    C55xx: Breakpoint Manager Dump: Breakpoint set by the system

    C55xx: Breakpoint Manager Dump:

    C55xx: Breakpoint Manager Dump: Disabled: 3

    C55xx: Breakpoint Manager Dump:

    C55xx: Breakpoint Manager Dump: Hardware Configuration

    C55xx: Breakpoint Manager Dump: Location: "C$$IO$$"

    C55xx: Breakpoint Manager Dump: Debugger Response

    C55xx: Breakpoint Manager Dump: Condition:

    C55xx: Breakpoint Manager Dump: Skip Count: 0

    C55xx: Breakpoint Manager Dump: Current Count: 0

    C55xx: Breakpoint Manager Dump: Action: Process CIO

    C55xx: Breakpoint Manager Dump: Miscellaneous

    C55xx: Breakpoint Manager Dump: Group: Default Group

    C55xx: Breakpoint Manager Dump: Name:

    C55xx: Breakpoint Manager Dump: Breakpoint set by the system

    C55xx: Breakpoint Manager Dump:

    C55xx: Breakpoint Manager Dump: Hardware Configuration

    C55xx: Breakpoint Manager Dump: Location: "C$$EXITE"

    C55xx: Breakpoint Manager Dump: Debugger Response

    C55xx: Breakpoint Manager Dump: Condition:

    C55xx: Breakpoint Manager Dump: Skip Count: 0

    C55xx: Breakpoint Manager Dump: Current Count: 0

    C55xx: Breakpoint Manager Dump: Action: Terminate Program Execution

    C55xx: Breakpoint Manager Dump: Miscellaneous

    C55xx: Breakpoint Manager Dump: Group: Default Group

    C55xx: Breakpoint Manager Dump: Name:

    C55xx: Breakpoint Manager Dump: Breakpoint set by the system

    C55xx: Breakpoint Manager Dump:

    C55xx: Breakpoint Manager Dump: Hardware Configuration

    C55xx: Breakpoint Manager Dump: Location: "C$$IOE$$"

    C55xx: Breakpoint Manager Dump: Debugger Response

    C55xx: Breakpoint Manager Dump: Condition:

    C55xx: Breakpoint Manager Dump: Skip Count: 0

    C55xx: Breakpoint Manager Dump: Current Count: 0

    C55xx: Breakpoint Manager Dump: Action: Process CIO

    C55xx: Breakpoint Manager Dump: Miscellaneous

    C55xx: Breakpoint Manager Dump: Group: Default Group

    C55xx: Breakpoint Manager Dump: Name:

    C55xx: Breakpoint Manager Dump: Breakpoint set by the system
  • if I understand correctly, the output indicates that there is only one breakpoint enabled at the exit point of the application (which is common). From the debugger point of view, that is what is known to it.

    I don't know why your application is halting where it is. It could be that it is halting for some other reason and the debugger just assumes it is because of a breakpoint.

    Before trying some other troubleshooting techniques, I strongly recommend upgrading to the latest version of CCS (v6.1.2). CCSv5 is fairly old and there have been many bug fixes since then.

    ki
  • I am using TMS320C5535 with DSP/BIOS and I need RTA legacy for debugging so I don't think that is an option for me.
    I did a clean of CCS v5, and removed all .metadata and .TI, .TI-trace folders as recommended on the CCS Troubleshooting Guide, but I still have the same issue. I have modified the Debug options, removing the breakpoints for CIO function and Halt at program termination, and still have the breakpoint on the HWI_F_dispatch function. If I slightly modify my program, halt still happens on the same assembly line on HWI_F_dispatch, just after CALL AC0 that jumps to my i2c_isr function:
    CALL AC0
    it halts here -> POP AR0,AR1
    BSET ST1_ITM
    NOP
    NOP...

    I don't see any reason why the program should halt in the middle of a DSP/BIOS function. It was working fine before.
  • I did a search on the internet and there seems to be quite many issues with programs halting on non-existent breakpoints on Eclipse, but so far I could not find a solution for this issue. Please help.

  • Diego de la Cruz said:
    I don't see any reason why the program should halt in the middle of a DSP/BIOS function. It was working fine before.

    I don't know what is causing the issue, but suggest you enable Debug Server Logging, and post the debug server log file from a debug session in which the program halts in the middle of the DSP/BIOS function. It would also help if you post a CCS screen shot after the halt in the middle of the DSP/BIOS function.

    The debug server log should hopefully be able to show if the CCS debugger is actually setting a hardware breakpoint in the HWI_F_dispatch function, or if the target is halting for some other reason.

    Some other questions to try and understand the problem:

    1) Are any emulator errors reported in the CCS console after the unexpected halt in the DSP/BIOS function?

    2) Does the problem only happen with with one program, or several programs?

    3) Does the problem only happen with one board, or several boards?

  • Thanks for your help.

    Find here a screen shot after C55x_0 halt on unexpected HW breakpoint:

    This is a zip file with the debug server log, it's quite verbose. Halt takes place at address 0x15ea8 on DSP C55x_0, I see mention to EVENT_DSP_HALT, but I am not able to get a conclusion.
    dbgserver.zip

    Regarding your questions:

    1. No there are no emulator errors reported

    2. It only happens with this program, when I enable i2c interrupt to transfer data between both DSP, but I had already been able to transfer data with no halt issues.

    3. The problem only happens with one board, but it's the only one available I have.

  • Diego de la Cruz said:
    This is a zip file with the debug server log, it's quite verbose. Halt takes place at address 0x15ea8 on DSP C55x_0, I see mention to EVENT_DSP_HALT, but I am not able to get a conclusion.

    Searching the debug server log for the address 0x15ea8, which is where the hardware breakpoint halted execution, the first occurrence occurs just after the target status has changed to STATUS_HW_BKPT_HIT. i.e. I can't see that the CCS debugger has explicitly set a hardware breakpoint at the address 0x15ea8.

    Therefore, not sure what caused the hardware breakpoint to occur.

    I had a quick look at the TMS320C5535 documentation and couldn't see a description of how the hardware breakpoints get set. Wondering if it is possible for a running program to inadvertently set a hardware breakpoint in the on-chip emulation logic. Hopefully, someone from TI with an understanding of the TMS320C5535 emulation logic will be able to explain what caused the hardware breakpoint to occur.

  • I was able to reproduce the issue in another computer with a fresh installation of CCS v6. That discards any CCS issue of hidden breakpoint.
    The issue can only be related to my code.
    I discovered two errors:
    1. interrupt void keyword was not removed on one of the interrupt functions managed by HW dispatcher on the DSP that did not show the HW breakpoint halt.
    2. There was a missing IRQ_clear of the interrupt event on the interrupt service routine on both DSPs
    After correcting those issues I don't see any more unexpected halts on HWI_F_f dispatch function.

    I have added a HW interrupt INT_0 to be able to synchronise the code on both DSPs.
    However I have quite a hard time debugging the synchronisation between both DSPs. Statistics provide the time dedicated by each task, and LOG printf help too, but it's quite difficult to get an idea of the sequence of events. I miss some additional tool graphical or textual that could help with task sequencing.