This thread has been locked.

If you have a related question, please click the "Ask a related question" button in the top right corner. The newly created question will be automatically linked to this question.

Unable to collect PC Trace for ARM A15 core in 66AK2H14 using CCS 6.1.3 and XDS200 USB Onboard Debug Probe

Other Parts Discussed in Thread: 66AK2H12, AM4378, TCI6638K2K, 66AK2H14, TCI6636K2H, TCI6630K2L, 66AK2H06, 66AK2G02, 66AK2E05

Was using the following setup to attempt to capture PC Trace for an ARM A15 core:

- CCS 6.1.3.00033

- Keystone2 device support 1.1.5

- TI Emulators 6.0.228.0

- EVMK2H connected with its XDS200 USB Onboard Debug Probe

- Running SYS/BIOS example programs on ARM Cortex-A15 core zero

- The Target Configuration file set to a 66AK2H12 device, and the Initialization Script for the arm_A15_0 core set to ../../emulation/boards/xtcievmk2x/gel/xtcievmk2x_arm.gel

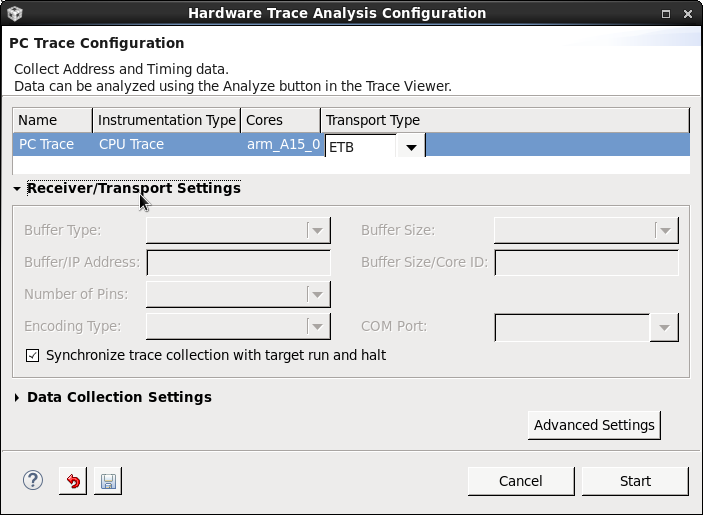
The PC Trace Configuration was setup with the default settings, and to use the ETB as the Transport Type:

When the PC Trace was started CCS didn't report any errors, and the Trace Viewer reported that the expected warning that "WARNING: Clock frequency not available. Cannot provide time in seconds" due to using the ETB.

However, after running the program the Trace Viewer is always showing 0 records:

Note that:

a) PC Trace collection works for a C66xx core.

b) In the target configuration file the Initialization script for the CS_DAP_DebugSS is set to "../../emulation/Keystone2/funnel.gel". If the initialization script is removed from the CS_DAP_DebugSS, then when attempt to start PC Trace collection for the ARM A15 core then CCS reports the following error, which means CCS is attempting to call the Enable_Funnel_For_PTM function inside the funnel.gel script:

  • I tried CCS 6.1.3 under both Windows 7 and Linux (CentOS 6.7) and in both cases have failed to collect PC Trace data for the arm_A15_0 core.

  • I noticed that the release notes for XDS Emulation Software Package 6.0.14.0 contains a note that the trace on ARM A15 cores on Keystone2 devices may fail with a TPIU flushing error if not all ARM cores are powered up. The Target Status shows that ARM cores 1 to 3 in the 66AKH14 weren't powered up when initially attached the CCS debugger. However, running the a TETRIS_POWER_UP_AND_PLL_INIT GEL script as per the release notes didn't make the PC trace work.

    Have now tried PC trace on all 4 A15 cores, and for all cores zero records were shown in the Trace Viewer.

    Attached is the trace logging enabled by setting the environment variable TI_TRACE_LOGGING to be equal to 6. The sequence was:

    • Attach to C6xx_0 core and run the TETRIS_POWER_UP_AND_PLL_INIT_175MHZ_TO_1400MHZ GEL script. Used the Target Status to confirm that this powered up all A15 cores
    • Attach to the arm_A15_0 core and download a SYS/BIOS example which halts at main
    • Enable PC trace on arm_A15_0 core using the default options and a ETB transport type
    • Run the SYS/BIOS example, which halts at a breakpoint in _exit() upon completion.
    • The Trace Viewer for the arm_A15_0 core shows 0 records.

    Towards the end of the trace log there is the following error from the ETM engine:

        E 21:02:06:334 | ARM Decode: ETM engine returned error in entering history info.
    M     21:02:06:334 | ARM Decode: SeekRead(). return from DecompressPage: SamplesDecoded = 0
    M     21:02:06:334 | ARM Decode: SeekRead(). Done with Output decoded trace Samples: SamplesDecoded = 0; SamplesUsed = 0
    

    Not sure if the "ETM engine returned error" is the root cause of the PC trace containing zero records, or as a result of no records being stored in the ETB.

    [When run PC trace on the Cortex-A9 on an AM4378 which successfully collects PC trace data in the ETB, there is no "ETM engine returned error" in the trace log]

    ti_trace_log_4152016_31369.txt.zip

  • Chester,

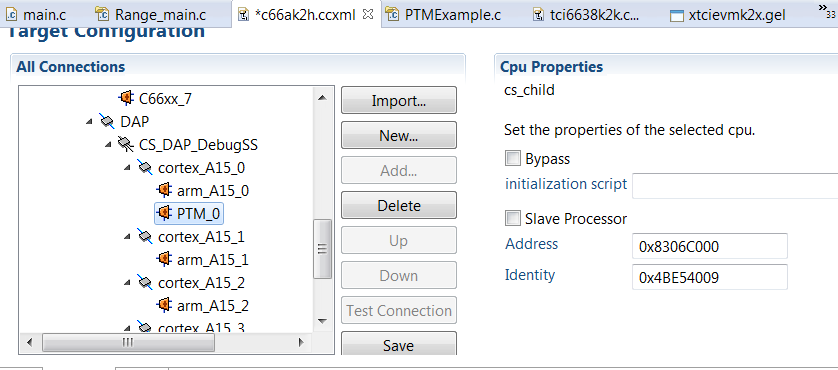
    I can reproduce the problem when configuring the target with the C66AK2H12 device.  It looks like there are some pieces missing in the device xml.  I was able to work around the issue by configuring my device as TCI6638K2K.  Alternatively, you can add a couple of nodes to your existing ccxml.


    The addresses for all PTMs are:

    PTM_0: Address = 0x8306C000; Identity = 0x4BE54009

    PTM_1: Address = 0x8306D000; Identity = 0x4BE54009

    PTM_2: Address = 0x8306E000; Identity = 0x4BE54009

    PTM_3: Address = 0x8306F000; Identity = 0x4BE54009

    When adding the PTM_* nodes, select cs_child as CPU type.

    When adding the CSETB_PTM, select CS_ETB as CPU type.

    I believe either of these workarounds will fix your issue.  In the meantime, I will follow up with the owners of the xml to get this resolved.  Apologies for the inconvenience.

    Thanks,

    Mark

  • Mark Garrett said:
    I can reproduce the problem when configuring the target with the C66AK2H12 device.  It looks like there are some pieces missing in the device xml.  I was able to work around the issue by configuring my device as TCI6638K2K.

    Thanks for the information. I see the TCI6638K2K is super-set of the 66AK2H14, in that the both devices have the same CPUs but the TCI6638K2K has more peripherals. Will therefore try using the TCI6638K2K device in the target configuration.

    Out of curiosity, I looked at some other Keystone II ARM+DSP device files. For the following devices the PTM_x nodes and sometimes the CSETB_PTM node also appear to be missing:

    • TCI6636K2H
    • TCI6630K2L
    • 66AK2H06
    • 66AK2G02
    • 66AK2E05

    Not sure if any of these other device XML files need to change (I don't have these devices so unable to test the ARM Cortex A15 PC trace on the above devices)

  • Mark Garrett said:
    It looks like there are some pieces missing in the device xml.  I was able to work around the issue by configuring my device as TCI6638K2K.

    I confirm that by selecting the device as a TCI6638K2K in the Target Configuration, I was able to collect PC Trace for all the four ARM Cortex-A15 cores in a 66AK2H14.