Hey John,
thanks for your help! I thinks that works now.
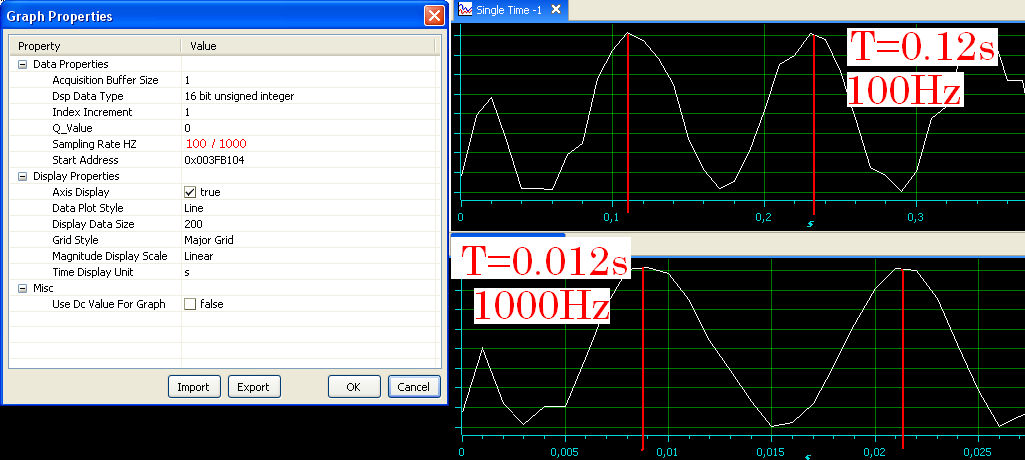
But today i notice that if i display a graph with a different Sampling Rate HZ variable, then i got a different signal?
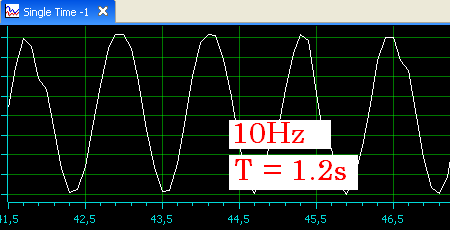
In the following picture i i display the signal one time with 1 Hz Sampling Rate and one time with 100 Hz Sampling Rate.

Why i got there different cycle durations?
Thanks for your awesome help!!
regards
thomas