This thread has been locked.
If you have a related question, please click the "Ask a related question" button in the top right corner. The newly created question will be automatically linked to this question.
Hi, everyone. My problem looks similar to one, described here https://e2e.ti.com/support/development_tools/code_composer_studio/f/81/t/333632 .
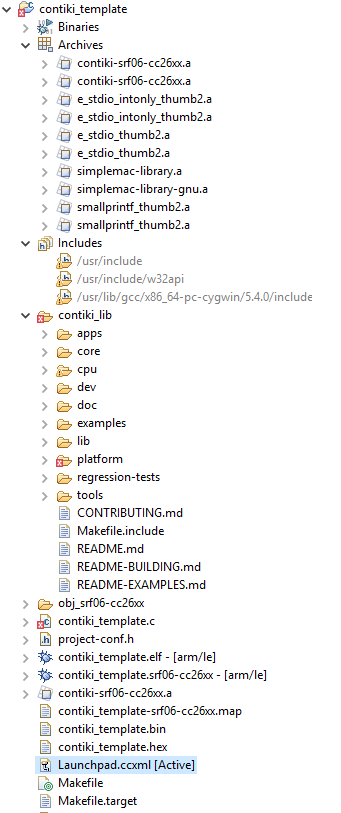
My HW setup is CC1310 Launchpad with built-in XDS110. Software tools are following: Windows 10, CCS Version: 6.1.3.00034, GCC ARM toolchain v5.4, CygWin make utility. My current goal is to deploy Contiki OS to CC1310. I downloaded git repo and modified makefile to build debug configuration(optimization –O0 and –g flag), application code is cc26xx-demo from examples folder. CCS project is configured for external makefile. Now I have following project structure:
It builds ok and works as supposed to, when downloaded to the MCU. The problem appears, when I try to debug this code. I use following debug target configuration.
After device is flashed I get following window and everything seems to be OK.
I can place breakpoints, navigate through code or control program execution with “Step intro”, “Step over” and “Step return”. But when I hit “Resume” button, all breakpoints are ignored so I cant control program flow. After pushing “Suspend” button following message appears: "No source available for 0x1000486".
Few seconds late target device disconnects with following message: “Cortex_M3_0: JTAG Communication Error: (Error -1170 @ 0x0) Unable to access the DAP. Reset the device, and retry the operation. If error persists, confirm configuration, power-cycle the board, and/or try more reliable JTAG settings (e.g. lower TCLK). (Emulation package 6.0.222.0)”.
After re-connect and device reset (sequence shown in the following figure) debugger will find the corresponding code, but after resuming and suspending program execution the error will repeat.
I tried different flags (-gdwarf-3 -gstrict-dwarf –g -gdwarf-2) but problem still persists. When I use TI-RTOS with CCS (no external makefile required) breakpoints work OK. Can anyone please tell me, what am I doing wrong?
Vadim Mischuk86 said:I can place breakpoints, navigate through code or control program execution with “Step intro”, “Step over” and “Step return”. But when I hit “Resume” button, all breakpoints are ignored so I cant control program flow. After pushing “Suspend” button following message appears: "No source available for 0x1000486".
How are you setting the breakpoints, by clicking in the editor margin? If you open the Breakpoints view, do you see the breakpoints enabled? Can you try setting the breakpoint from the disassembly view rather than the editor view and see if that helps?
The message "No source available for 0x1000486" in itself does not indicate a problem. This type of message is expected when the code is halted at an address for which there is no source code association. You can open the Disassembly view and check what is at that address and try to continue debugging from there.
Vadim Mischuk86 said:Few seconds late target device disconnects with following message: “Cortex_M3_0: JTAG Communication Error: (Error -1170 @ 0x0) Unable to access the DAP. Reset the device, and retry the operation. If error persists, confirm configuration, power-cycle the board, and/or try more reliable JTAG settings (e.g. lower TCLK). (Emulation package 6.0.222.0)”.
It seems like the debugger is losing communication with the target device. It could be a hardware issue triggering this or something in the application occurring at run time. I personally have not tried the Contiki demo code you are working with, so cannot comment on whether it is known to work well with CCS. You may want to also ask in the Wireless Connectivity forum as the users might have already tried this scenario and may have additional insight.
Thanks for your reply.
AartiG said:How are you setting the breakpoints, by clicking in the editor margin? If you open the Breakpoints view, do you see the breakpoints enabled? Can you try setting the breakpoint from the disassembly view rather than the editor view and see if that helps?
AartiG said:You can open the Disassembly view and check what is at that address and try to continue debugging from there.
When I suspend program flow it shows me following, anyway, few seconds later after suspending error 1170 appears.
I wonder, is that OK to have such large pointers(0x10000486) on my device which have only 128k of flash?
Vadim Mischuk86 said:When I suspend program flow it shows me following, anyway, few seconds later after suspending error 1170 appears.
There is something triggering a fault, as the program is halted in FaultISR(). It may be related to how the application itself is set up, the linker command file being used etc. Unfortunately I don't have enough knowledge about this application to be able to provide more precise answers. As I mentioned before, the experts in the Wireless Connectivity forum might have other suggestions so I would suggest posting there.
AartiG said:There is something triggering a fault
That was watchdog. After commenting out watchdog initialization and startup function calls faults disappeared. Anyway breakpoints won't work. When I put breakpoint in my C code debugger still ignores it, no matter it is enabled. But when I put breakpoints in disassembly window, they work OK. Commands "run to line", "step into", "step over" also work OK.
Vadim Mischuk86 said:When I put breakpoint in my C code debugger still ignores it, no matter it is enabled. But when I put breakpoints in disassembly window, they work OK.
Since you are working with an external makefile project, I wonder if your issue is similar to this thread.
There is also another known issue mentioned in this post. Although I don't think this specifically relates to your scenario, I just wanted to make you aware of this as well.
The breakpoints are shown with a "blue circle" symbol, which means they are Eclipse breakpoints and not actually set on the target.Vadim Mischuk86 said:
Breakpoints which are set on the target have the following symbol displayed in the Breakpoints view:
When you place the breakpoints in the disassembly window, what symbol gets shown in the Breakpoints view?
As per the threads AartiG has referenced, I think the problem is that when you try and set a breakpoint by clicking on a line in the source file editor CCS doesn't associate the source file with the program being debugged which leads to the breakpoint not being set on the target.