This thread has been locked.
If you have a related question, please click the "Ask a related question" button in the top right corner. The newly created question will be automatically linked to this question.
Part Number: CCSTUDIO-SITARA
Tool/software: Code Composer Studio
Hello,
J am using CCS Version: 6.1.2.00015 with the Sitara processor.
I re-write my code to improve it in C++ language, If I debug it, impossible to watch the content of a class.
My code:
1: childClass.cpp
class ChildClass
{
public:
ChildClass();
virtual ~ChildClass();
unsigned short value0;
unsigned short value1;
};
2: MasterClass.cpp (contains a childClass):
class MasterClass
{
public:
MasterClass();
virtual ~MasterClass();
unsigned short masterValue;
ChildClass m_child;
};
3: CppCall.cpp (main class, contain global masterClass):
MasterClass* m_pMaster; // global MasterClass* generate by a new (heap)
MasterClass m_pMasterPlat; // global Masterclass generate in the .bss segment (pInit zone)
void MainCall(unsigned short nAlStatus)
{
if (m_pMaster == NULL)
m_pMaster = new MasterClass(); // allocate it in the heap zone
m_pMaster->masterValue = 5;
m_pMasterPlat.masterValue = 10;
return 0; // breakpoint HERE
}
4:The watch résult after the breakPoint:
It's ok for the MasterClass generate in the .bss zone:
It's bad for the MasterClass generate by the new:
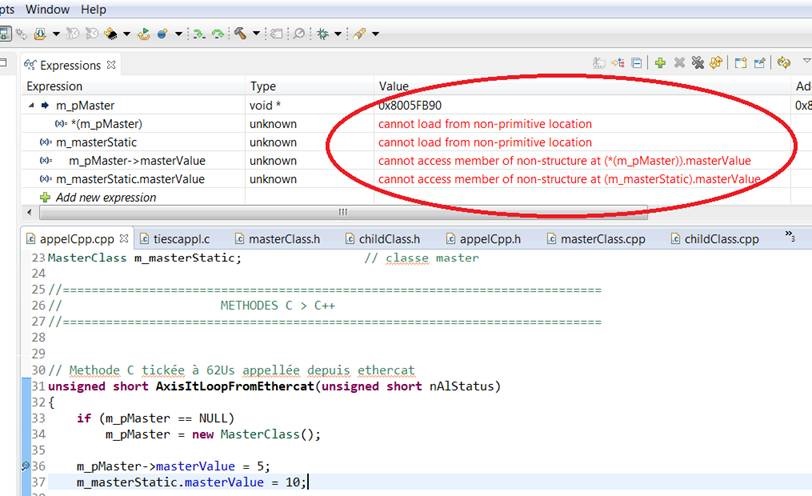
The Expressions Window:
Is there any options to enable the acces to this variables ?
In another post I find this reply: "If the full symbolic debug is turned on and the optimizer is off", so, in what sections these parameters are precisely located ?
Jm
I forgot to mention, I am using CCSv6.2. There may be an issue with CCSv6.1.2. I don't have 6.1.2,but I do have 6.1.1 and 6.1.3. I'll try those and get back with you.
Stephen
A ccs version porblem, Humm, this seems unlikely.
Tomorow, I install the CCSv6.2 version and I try again.
Sorry, the link is bad ?
Hello,
We are again focus on this suject: impossible to see class variables in the "Watch Expresssions" window while debugging with ccsv6.
The configuration we are using is the following:
It is important to precise that we are coding in C++ (that's obvious because we are using classes).
We have made the follwing tests:
1/ We tried to use C++ classes in another project witch is compiled with Texas Compiler TI v5.2.5 and here it is PERFECT: we can see all classes variables an we can even go into Child Class.
2/ We have updated all our tools: CCS v7.1.0 with compiler GNU Linaro v4.9.3. And there is always the old same problem: impossible to see classes variables. It is even worst: we can't see neither the dynamic class nor the static one. And we have the error message you can see in attached.
We have searched an explanation to solve this error (increase the heap size, the stack size, changing the debug option....) but nothing work !
We tried to find something on the CCS Forum but nothing correspond to our problem.
In my mind, I think the problem comes from the GNU debugger because debugging seems to work well, while using TI Compiler.
Is there anyone who can help us on this subject and give us any advice to debug easily because we are stuck for the moment.
Thanks a lot for your help !
Jean-Michel
I created the attached example project for an AM335x based upon your code. AM335_GCC_class_variables.zipjean-Michel Vignolles said:J am using CCS Version: 6.1.2.00015 with the Sitara processor.I re-write my code to improve it in C++ language, If I debug it, impossible to watch the content of a class.
The project uses the GNU v4.9.3 compiler.
When run under CCS 6.1.3.00033 I can repeat your results in that the debugger can display the value of m_pMasterPlat.masterValue, but can't display the contents of m_pMaster :
I tried the same example with the "latest" CCS 7.1.0.00014 and the results are worse in that unable to display the contents of neither m_pMaster nor m_pMasterPlat :
Given the change in behavior from CCS 6.1.3 to 7.1.0 I suspect a bug in how CCS is extracting the definition of the class types from the GNU debug information. Hopefully someone from TI will investigate.
I also tried the example program compiled with the TI ARM compiler, and CCS 7.1.0 was correctly able to display the values of m_pMaster and m_pMasterPlat.
Hello Chester,
Thanks for your help,
Yes, I am agree with your opinion: an incompatibilty between CCS and Gnu Debugger, I hope that someone from TI will be able to solve it fastly.
Because we are actually in a dead end...
Regards.
JM
In that thread found by stevenh the work-around was to build for DWARF2 .stevenh said:Does the following help?
e2e.ti.com/.../415869
I don't have a Sitara device at the moment, but modified my previous test case to run in an EK-TM4C129EXL. TM4C_GCC_class_variables.zip Using CCS 7.0.0.00042 and the GNU compiler v4.9.3 I get the same problem if build for either DWARF4, DWARF3 or DWARF2. Example debug output when built for DWARF2:
Therefore, building for DWARF2 doesn't work-around the problem in this thread on not being able to see class variables in the debugger.
Hello,
We have also made the test with DWARF2 and we have exactly the same issue as Chester !
So, nothing is resolved....
We can notice that the problem seems to be worse with CCS v7 than with CCS v6 because before we managed to see more things in the watch window !
Is there anyone who can give us a little help please ?
Thanks a lot,
Jean-Michel & Laurence