This thread has been locked.

If you have a related question, please click the "Ask a related question" button in the top right corner. The newly created question will be automatically linked to this question.

CCS/TM4C129ENCPDT: Debug Exception stack does not show cause of exception, only what happens after

Part Number: TM4C129ENCPDT
Other Parts Discussed in Thread: SYSBIOS

Tool/software: Code Composer Studio

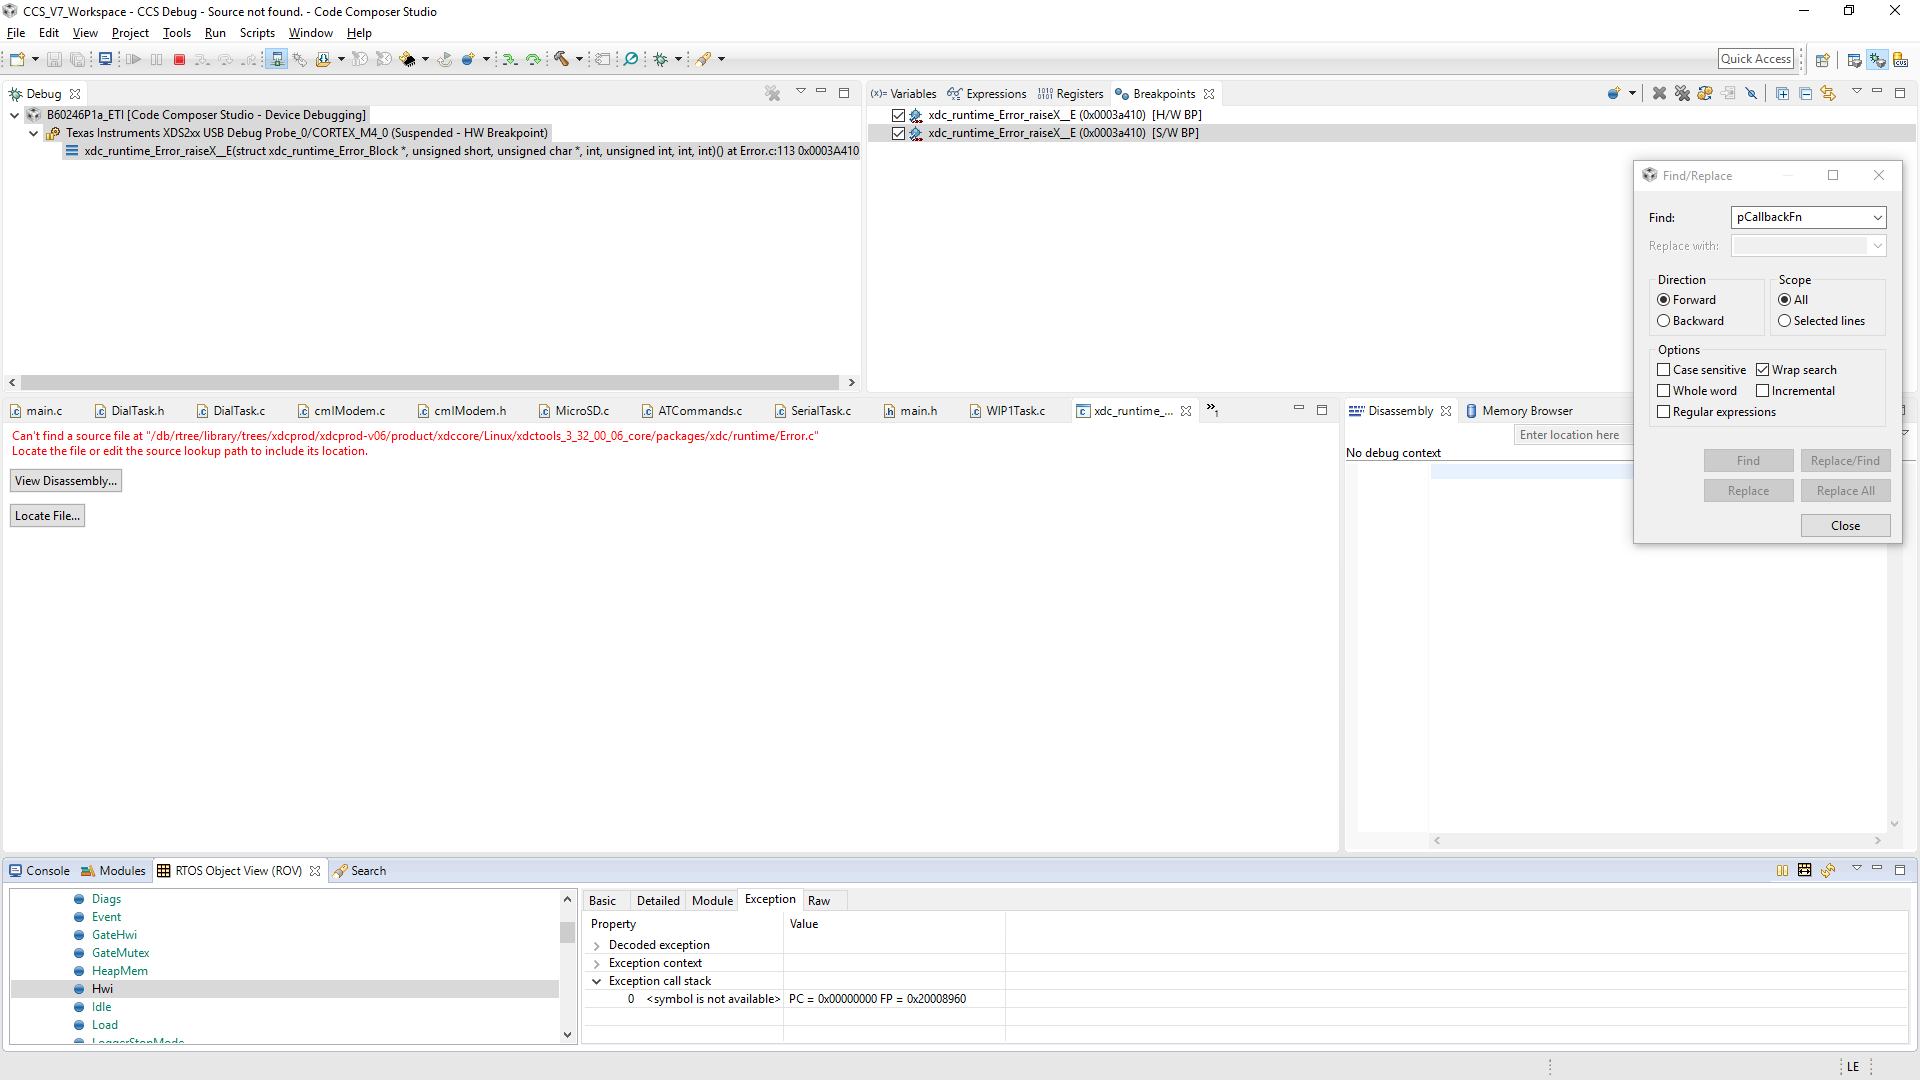
I am using TIRTOS under CCSV7.  When I get an exception the debug window shows only what happened from the point of the exception onwards until loader_exit

It seems to destroy the stack leading up to this point (Which is the most useful bit)

example

B60246P1a_ETI [Code Composer Studio - Device Debugging] 
 Texas Instruments XDS2xx USB Debug Probe_0/CORTEX_M4_0 (Suspended) 
  loader_exit() at exit.c:55 0x00032EB0  
  abort() at exit.c:130 0x00032EBA  
  exit(int)() at exit.c:121 0x00032EF0  
  xdc_runtime_System_exit__E(int)() at System.c:131 0x00039B0A  
  ti_sysbios_BIOS_exitFunc__I(int)() at B60246P1a_pem4f.c:3,349 0x00039C5A  
  ti_sysbios_family_arm_m3_Hwi_excHandlerMax__I(unsigned int *, unsigned int)() at BIOS.c:109 0x00018CA0  
  ti_sysbios_family_arm_m3_Hwi_excHandler__I(unsigned int *, unsigned int)() at Hwi.c:871 0x00039016  
  0xFFFFFFF0  (no symbols are defined for 0xFFFFFFF0) 

I can use ROV to see which thread this is in, but have no idea where in the thread the exception is because the stack trace doesn't show any information.

Why does the trace only start from the exception?

Is there any way to increase its length, ensure it includes the event?

  • Hi,

    I suspect you are running into the bug mentioned in the thread below. Can you confirm that?
    e2e.ti.com/.../2088665

    Regards,
    Rafael
  • Hello Rafael

    It is possible that this is the same bug, not sure how to verify it.

    It is very annoying as the closest you can tie a bug down to is a thread.

    All that shows is the stack trace from the point of the exception until the exit function, where as you really need the call stack showing which function was called prior to the exception.

    Is there any solution to this bug?

    I get the same with XDS100V2 debug probe and XDS2XX debug probe

    They mention setting breakpoint at "xdc_runtime_Error_raiseX__E" how do I do this, which file is it in?

    I changed View performance (Window/preferences) from 10 stack frame to 20 and that made no difference

    Also tried unchecking the limit stack frame option and that made no difference

  • I figured out how to set breakpoint at xdc_runtime_Error_raiseX__E by using the right click in breakpoints on debug view and selecting breakpoint which allowed me to enter the "xdc_runtime_Error_raiseX__E" and not need to know in which file.

    However when the exception occurs I still don't get the stack.
    I also tried different optimisation levels with the same result.

    I am using the Ti V16.9.0 LTS compiler with TIRTOS 2.16.1.4 and CCS V7
  • Barry Andrews said:
    I figured out how to set breakpoint at xdc_runtime_Error_raiseX__E by using the right click in breakpoints on debug view and selecting breakpoint which allowed me to enter the "xdc_runtime_Error_raiseX__E" and not need to know in which file.

    The thread referenced by Rafael in which I suggested setting a breakpoint on xdc_runtime_Error_raiseX__E is due to a bug where CCS doesn't display a full stack backtrace when using the GCC ARM compiler. Since you are using the TI ARM compiler you are not suffering from bug CCBT-2049.

    Barry Andrews said:
    However when the exception occurs I still don't get the stack.

    After an exception has occurred, the stack backtrace shown in the Debug window contains the SYS/BIOS exception handling code. The backtrace for the application code should be shown in the "Exception call stack" property of the Exception tab under the Hwi module. Below is an example screen shot after an exception has occurred:

    The Exception call stack in the ROV contains the actual application call stack which generated the exception. Does the ROV view give a meaningful stack in your case?

  • Hello Chester

    Thanks for your reply, sorry for my delayed response.

    The ROV stack has only the exception call stack, it has no other stack information.

    The ROV at least allows me to determine which thread was running when the exception occurs but nothing else.

    I set a deliberate call to a null pointer within one of my tasks, this is all the information I get from the debugger.

    Looking at the tasks I can determine the thread but that's it

    Regards

    Barry