This thread has been locked.

If you have a related question, please click the "Ask a related question" button in the top right corner. The newly created question will be automatically linked to this question.

CCS/TMS570LS2124: Hardware Trace Analysis Error: "Internal Software Error While Applying Trace Settings"

Part Number: TMS570LS2124
Other Parts Discussed in Thread: LAUNCHXL2-TMS57012

Tool/software: Code Composer Studio

Hello,

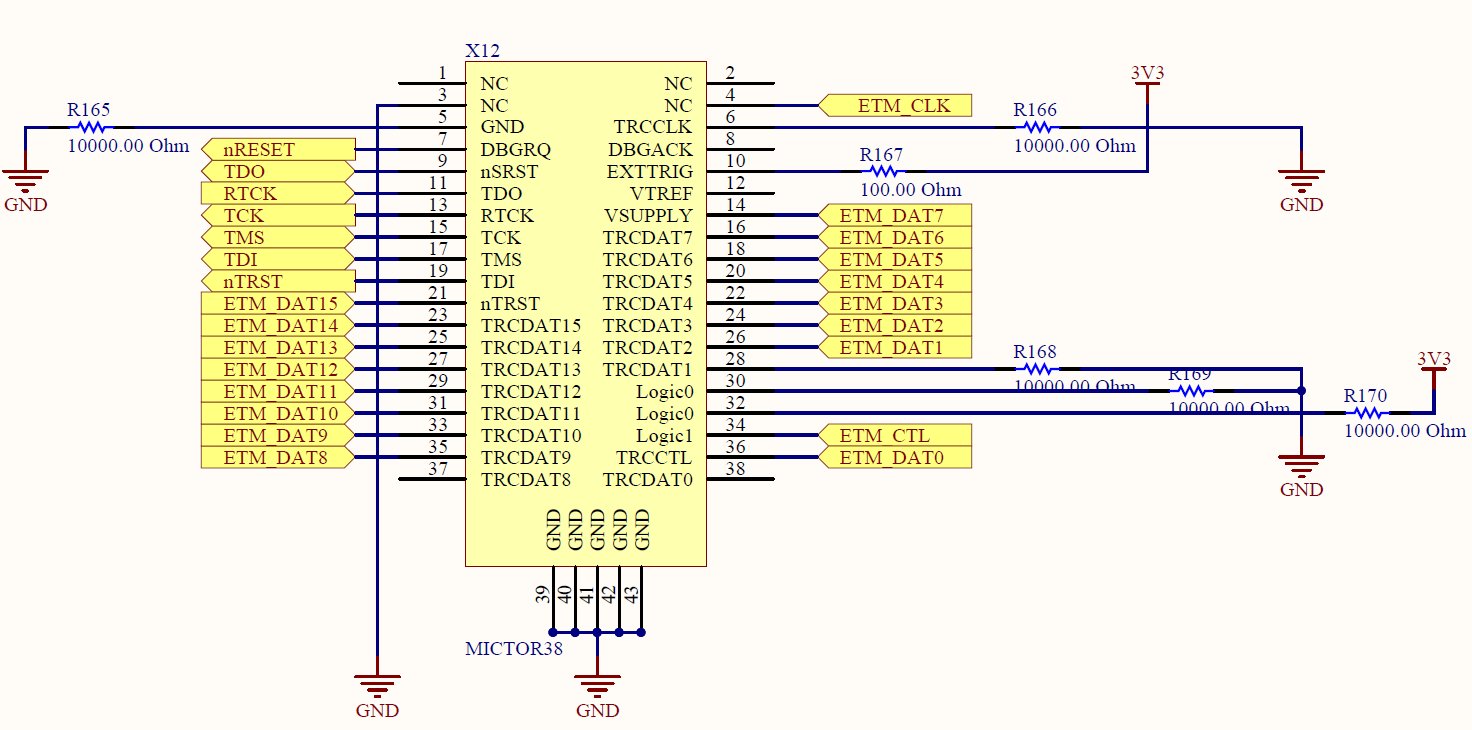
My custom board has TMS570LS2124 and i am trying to do trace (i.e. function profiling) with XDS560v2 Pro Trace.

I am using CCS 6.2.0.00050.

If i try to use ETB option in the Function Profiling, i get the following error:

"Could not run analyser on CortexR4. Cause:
Read device ID did not match with the device description available.
Possible reasons:
(1) Target is not connected
(2)Trace support for the device is not available in the version of the software."

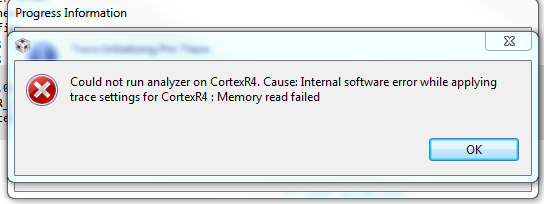
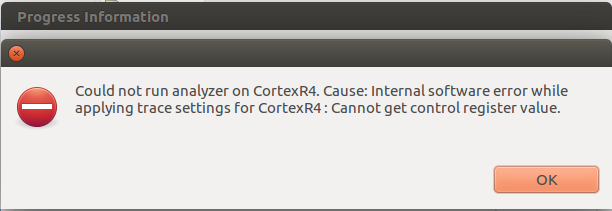
When i select "Pro Trace" option in the Function Profiling following problem in the screenshots are obtained.
(1. screenshot is from Windows PC, 2. screenshot is from Ubuntu)

After the error occurs, i can not connect the device again, until a reset is done.

How can i solve my problem ?

Best Regards,

Cagan

  • Cagan,

    In order for us to have some additional insights on what may be happening, please provide the logs mentioned in section 9.2 of the page below:
    processors.wiki.ti.com/.../Troubleshooting_CCSv6

    Does this issue happen with a development kit as well? This would help us track this issue in a more timely fashion.

    Regards,
    Rafael
  • Hello Rafael,

    I attached the log file in this post, hope it helps.

    We have only "LAUNCHXL2-TMS57012" as the development kit and it does not allow us to use Pro trace. (Is there a way that i can use Pro trace on this board ?)

    Best Regards,

    Ermanlog_02032017.zip

  • Erman,

    Please apologize; I should have been clearer. The cTools/Trace log is also fundamental to find out what may be happening in this case. Its method is described in section 9.2.2 of the page I sent before.

    In the meantime, I re-read your post and have a few questions:

    - Do you have a XDS ProTrace debug probe? I suspect so, but want to confirm.

    - If you do, have you configured your Target Configuration File to select the Spectrum Digital XDSPRO USB Emulator instead of the more common Spectrum Digital XDS560V2 STM USB Emulator?

    - Does your custom board followed the recommendations posted in the document SPRU655? This document describes the design details required to support Core Pin Trace with the Pro Trace.

    - Before you configure a trace job, you can try to Reset to the Default Settings and re-configure it. This tends to help with some unusual problems. 

    - At last, you can try to erase all Trace temporary files from its scribble area at:

    On Windows 7/8/10 the location is: /users/<userid>/.TI-trace

    >>Is there a way that i can use Pro trace on this board ?

    Well, it would not be practical as it would involve a re-design. I have a few development kits here (LS3137 and LC4357) that accept the Pro Trace and they used to work well with my CCSv6.2.0. Therefore this minimizes the possibility the tool itself has problems, but I will test them and report any issues I find. 

    Hope this helps,

    Rafael

  • Hello Rafael,

    Thank you for answers and suggestions. My problem continues but I have some follow-up information:

    1)  I have exactly the same emulator you linked: XDS ProTrace debug probe

    2) I rechecked again. My Target Configuration File is Spectrum Digital XDSPRO USB Emulator as it is supposed to be.

    4) I did reset-reconfigure suggestions. Didn't help, didn't change anything.

    5) I tried the same tracing operation on both Ubuntu and Windows. I cleared the folder you suggested. No help.

    6) Since i couldn't use pro-trace on the dev board i have, i quickly obtained the following:

    With this devkit PCB, trace WORKED just fine, as it is supposed to be.

    So all this brings us back to;

    3- Our custom board is different than SPRU655 because of space limitations. We are using 38-pin Mictor connector in our custom board. Below you can find the pinout of the custom board:

    And below is the pinout of the WORKING DEV KIT 60 pin connector. Basically we are not using all of the ETMDATA pins.

    Is it possible to trace our custom board with 38pin ? We can make some layout changes but it is impossible to carry the signals of full 60pin due to space limitation. Aren't we supposed to be able to trace with even 8bit ? Can you confirm that our board "should theoretically" work with the pinout i posted ?

    I will investigate the board in terms of skew and impedance aswell and soon post here about the values but in the document (i.e. page 29) it says not obeying the recommendations may reduce performance. Is there point, after which, i should expect these kind of error ?

    ALSO, My Not-Working Trace Problem Log according to 9.2.2 in the link you sent me.:

    Trace_Log.zip

    Best Regards,

    Cagan

  • Hello Rafael,

    I'd really appreciate your valuable comments in my situation.

    Best Regards,

    Erman

  • Erman,

    Please apologize for the delay; I was out of the office most of this week.

    Erman Ozdemir said:
    Is it possible to trace our custom board with 38pin ? We can make some layout changes but it is impossible to carry the signals of full 60pin due to space limitation. Aren't we supposed to be able to trace with even 8bit ? Can you confirm that our board "should theoretically" work with the pinout i posted ?

    The Trace interface allows to use anything from 10 to 19 pins, therefore you should be fine with the number of pins being shown in your schematics. However, I noticed the trace pins are shifted in your schematics diagram: for example, the ETM_DAT15 is tied to nTRST, ETM_DAT7 tied to Vsupply, etc. 

    Erman Ozdemir said:
    I will investigate the board in terms of skew and impedance aswell and soon post here about the values but in the document (i.e. page 29) it says not obeying the recommendations may reduce performance. Is there point, after which, i should expect these kind of error ?

    It is somewhat hard to tell. The memory read errors you are getting have a tight relationship with the signal integrity of the Trace data, but I don't know if such characterization tests were ever done. 

    Hope this helps,

    Rafael

  • Hello Rafael,

    We managed to overcome the issue ! Well, we made an adapter PCB which equalized our routing lengths below the specifications in SPRU655I, Table23. Now it is working and i can do the trace.

    Best Regards,

    Erman

  • Erman,

    Thank you very much for reporting back your findings. It can surely help other developers in the future.

    Best regards,
    Rafael