This thread has been locked.

If you have a related question, please click the "Ask a related question" button in the top right corner. The newly created question will be automatically linked to this question.

CCS/TM4C129XNCZAD: No source available for "xx"

Part Number: TM4C129XNCZAD
Other Parts Discussed in Thread: LMFLASHPROGRAMMER, TM4C1294NCPDT

Tool/software: Code Composer Studio

Hello,

I am attempting to run a debug session using code composer studio but my application is slightly different:

1. I have an existing project with its own series of makefiles used to compile the project on an external linux host machine.

2. I created a new c/c++ make file project with existing code.

3. under project->properties->c/c++ general->paths and symbols->source location, I've created links to all the source files

4. I compile the project externally on the server using the GCC compiler enabling debug compileer options to generate an .elf file which I load onto the processor during debug.

5. I can see that the debug session is running correctly.  I can step through the assembly code and the software is behaving as expected when the debug sessoin is running.

6. Target device is a tm4c129xnczad running on external 25Mhz oscillator

7. I am running code composer studio 7.

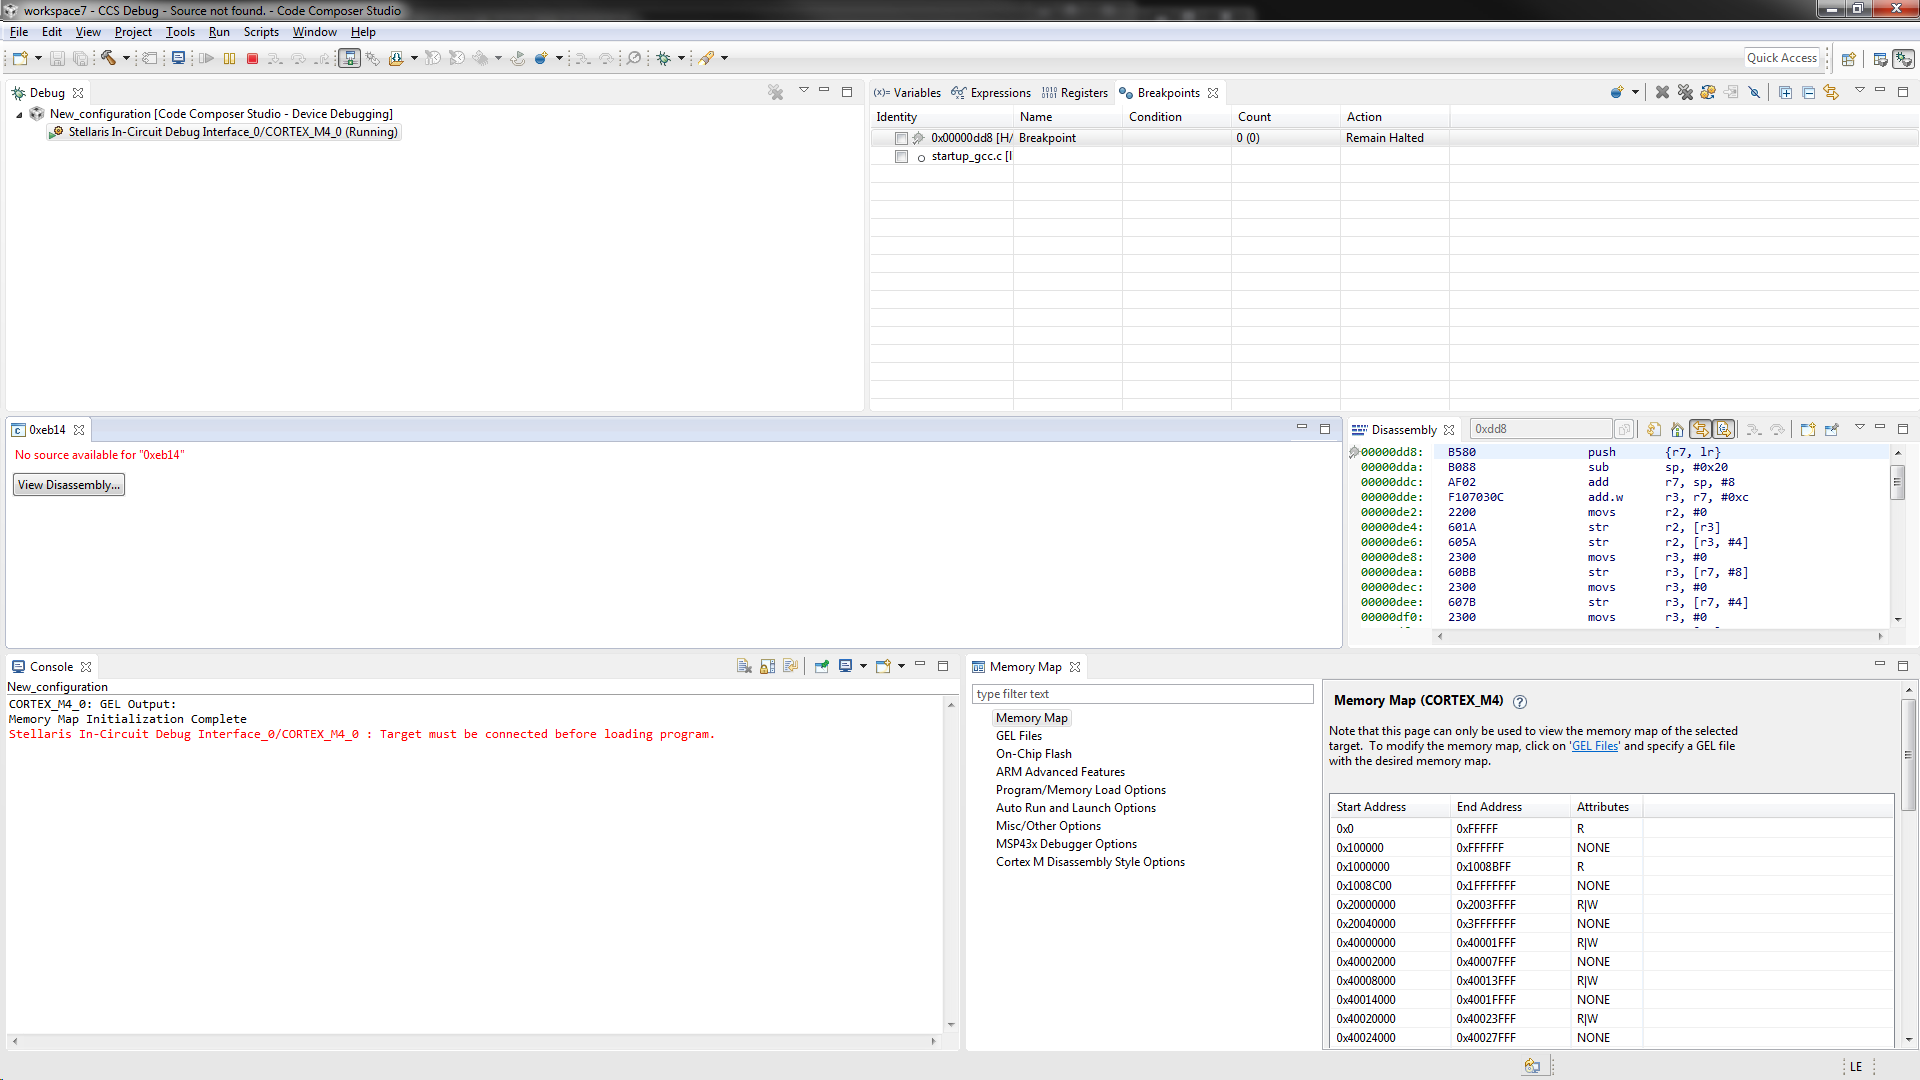
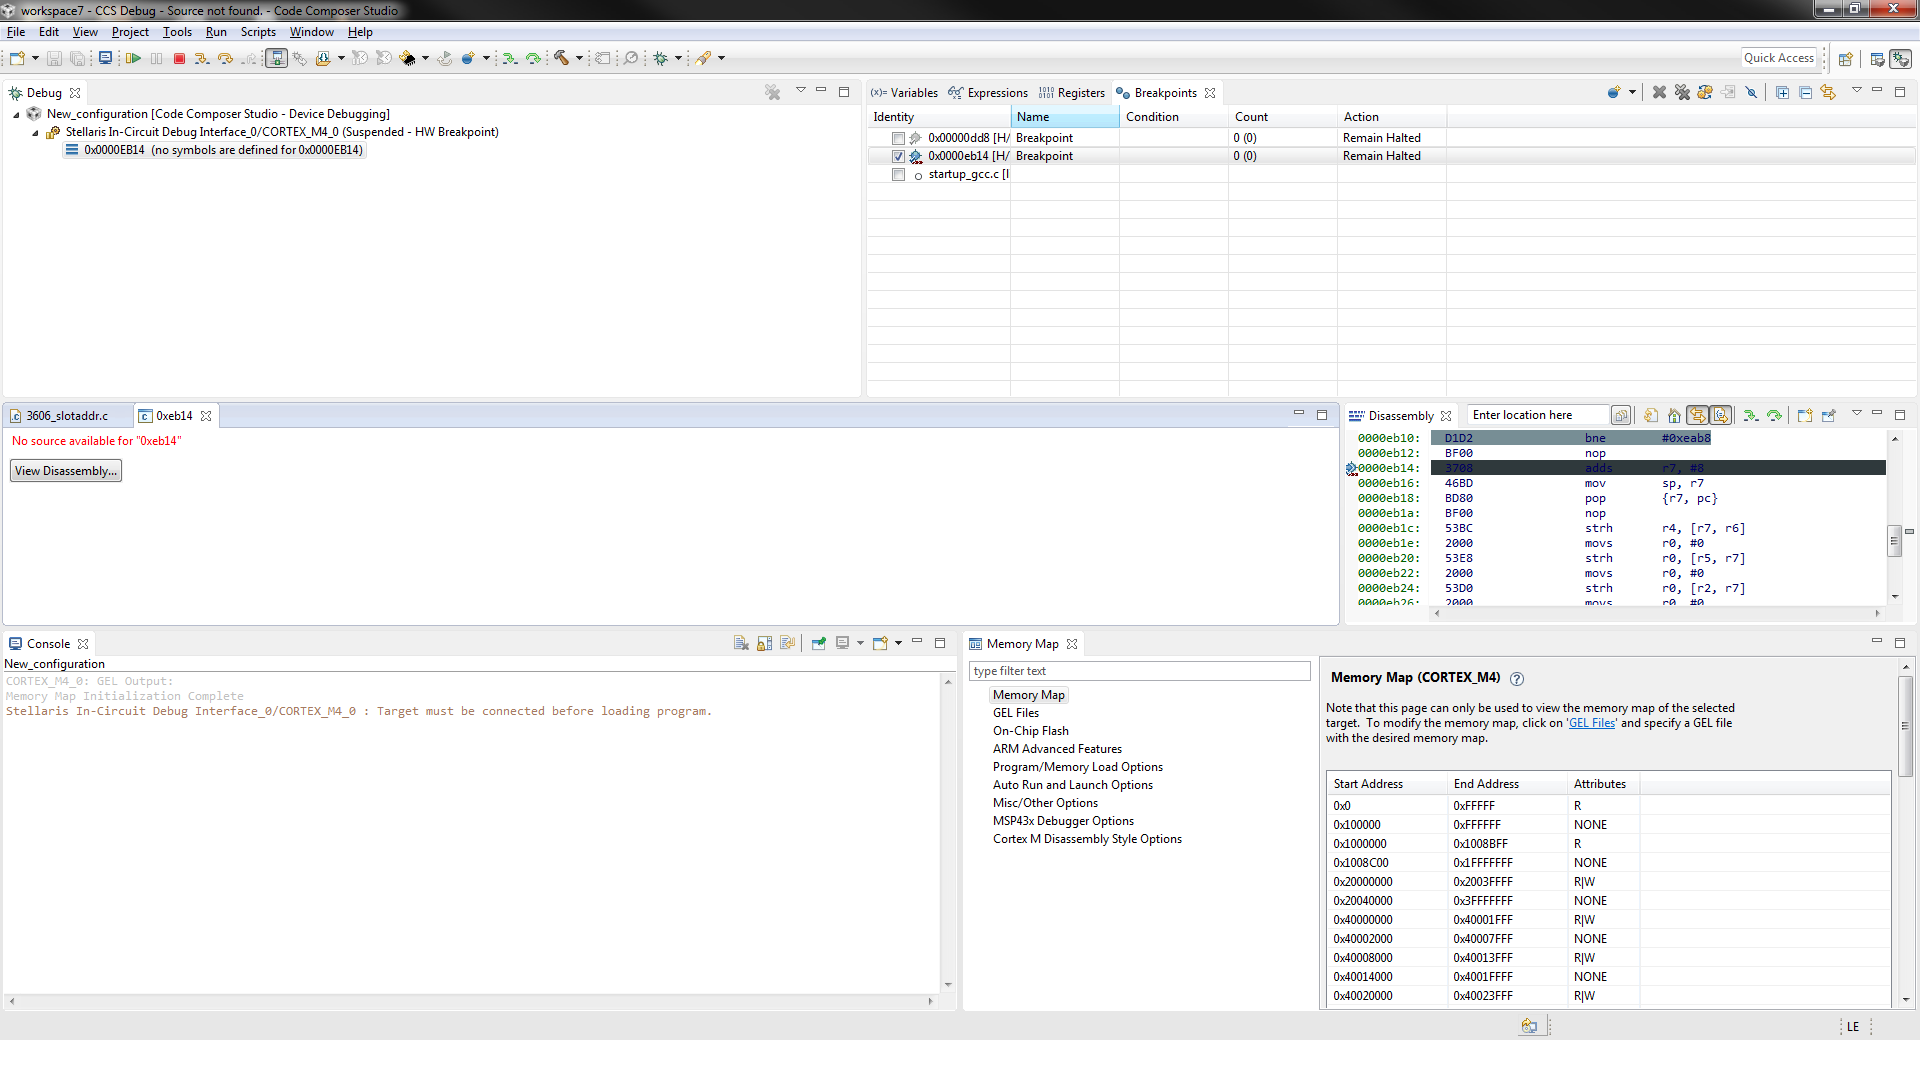
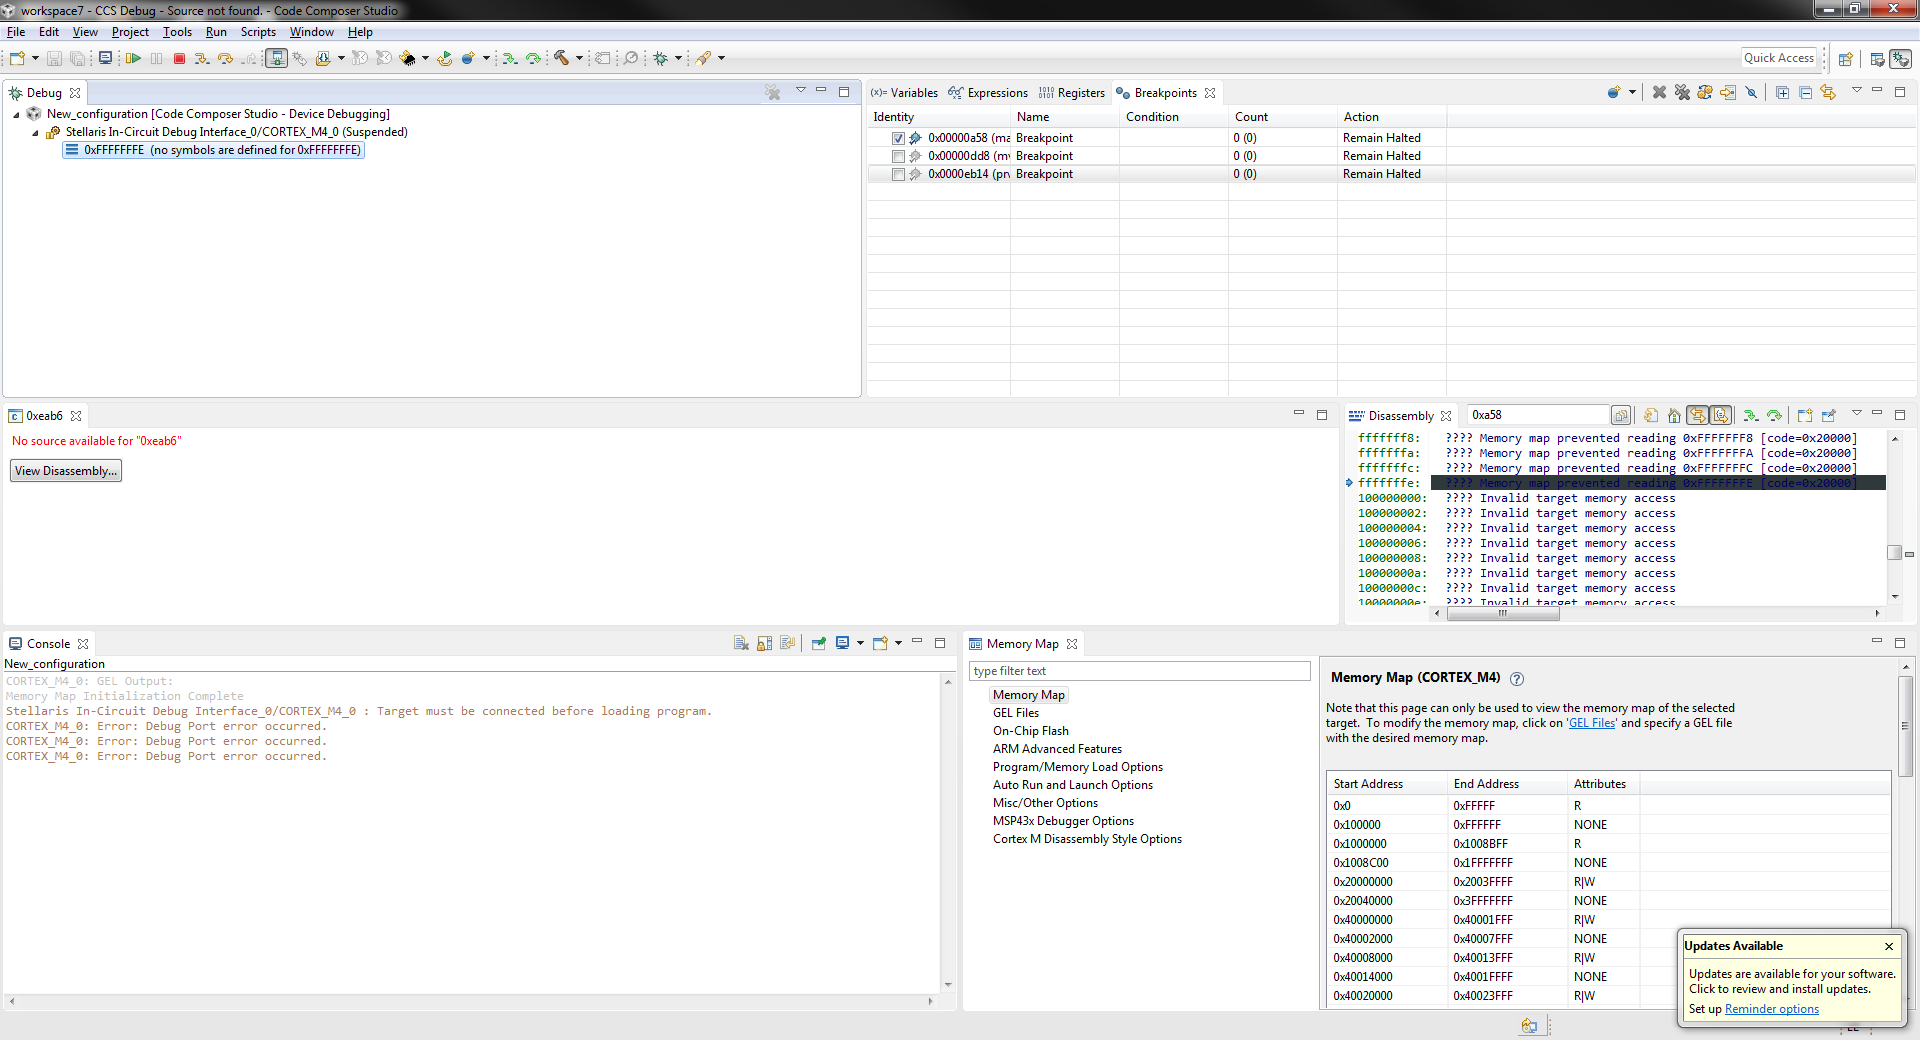
The problem I am facing is that I cannot view the .c or .cpp source code reference by the current program counter when I pause debug (although I am able to view the dissassembled code).  Instead, I get the following error "No source available for xx".  I believe there is some sort of setting problem with the debug session or project configuration but haven't found any information within the forums to explain this.   Below are some useful screen shots.  If any other information is required please let me know.

Your suggestions would be appreciated.  Thank you.

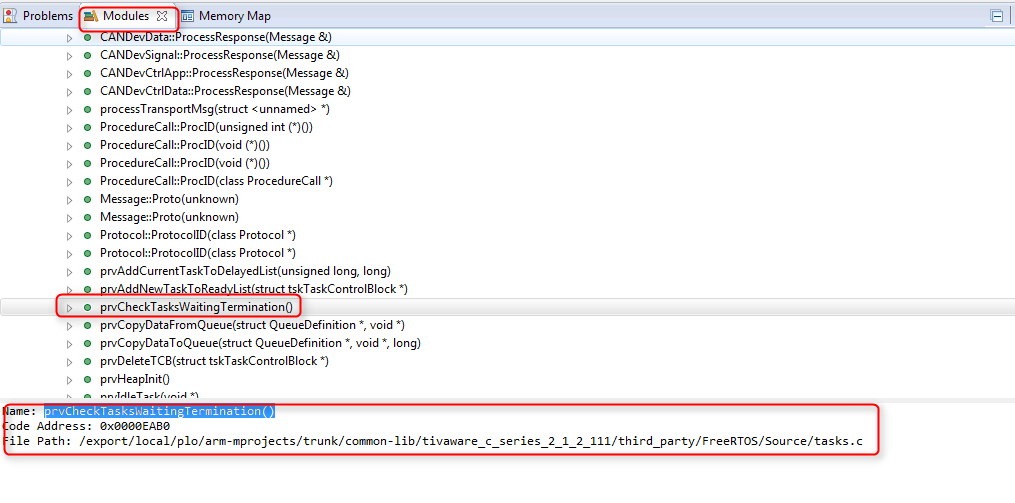
Screen shot of .elf file parsed by code composer. 

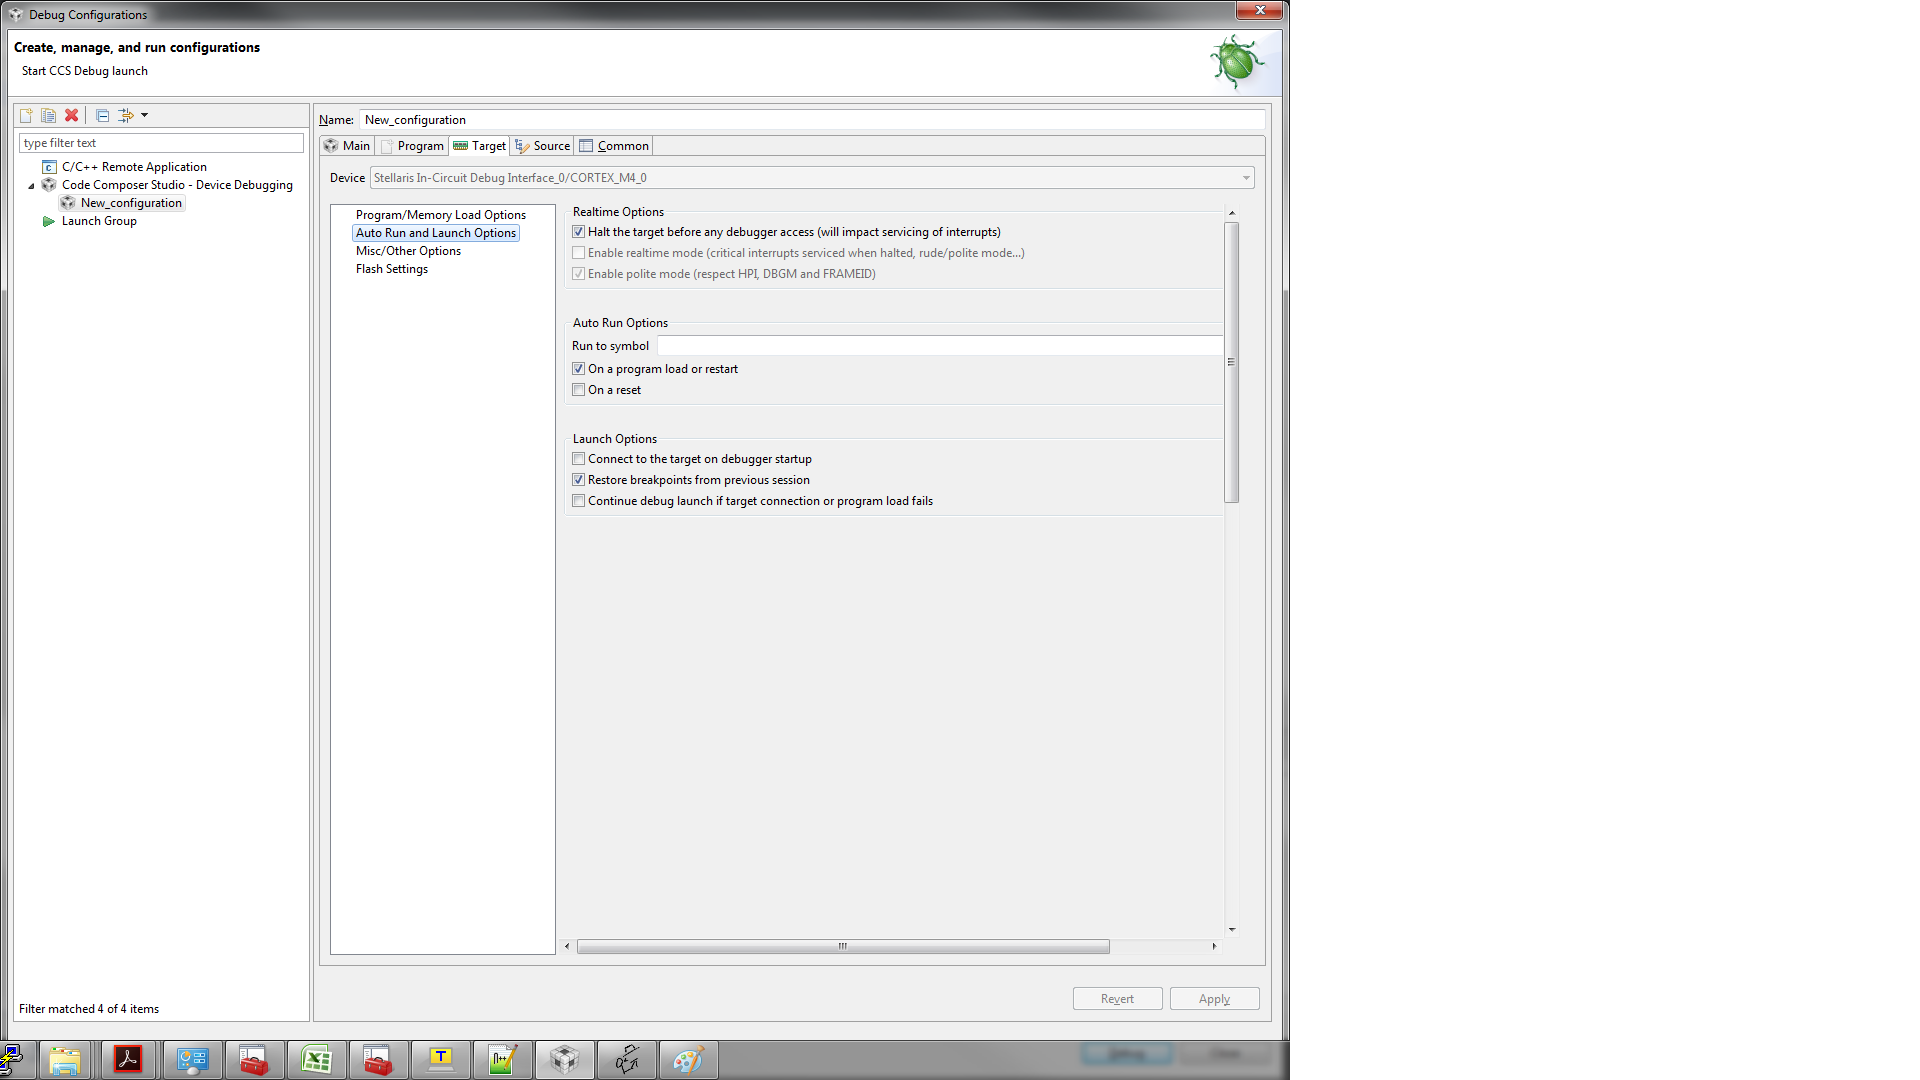
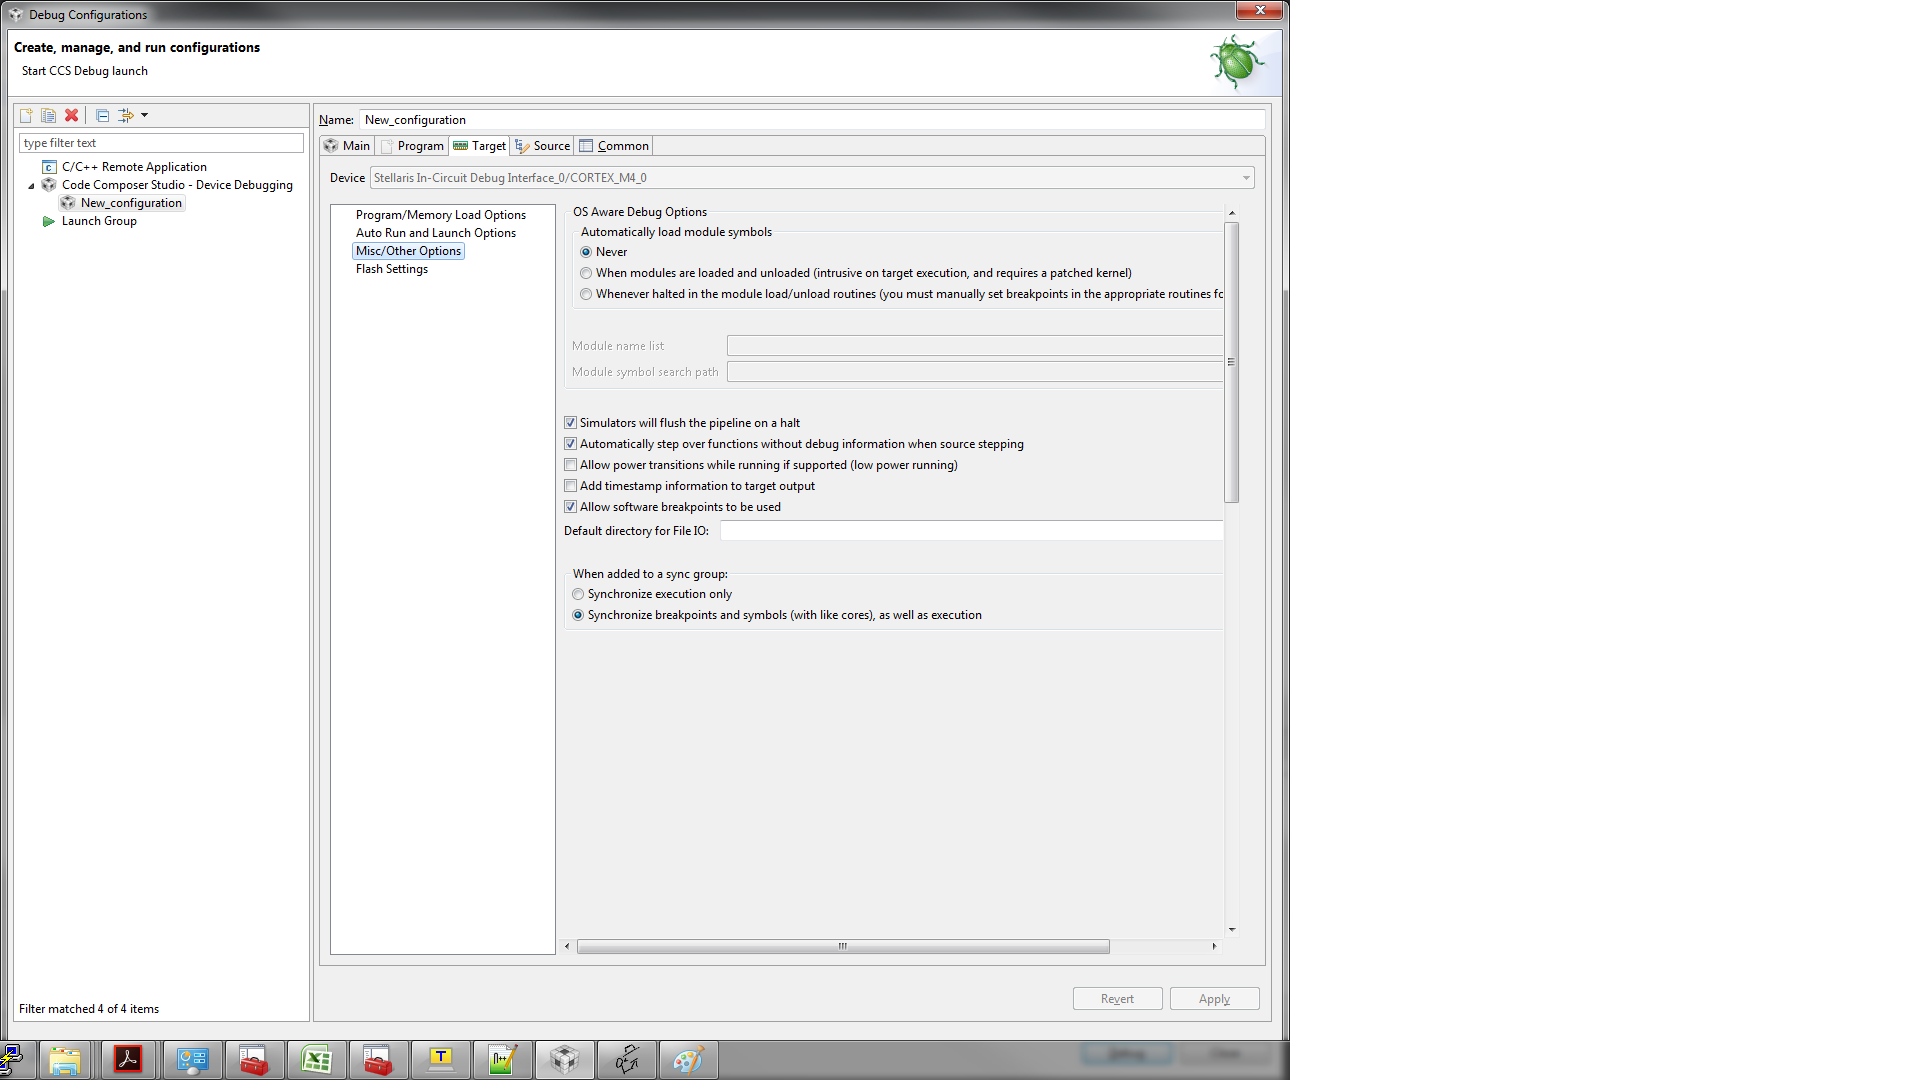
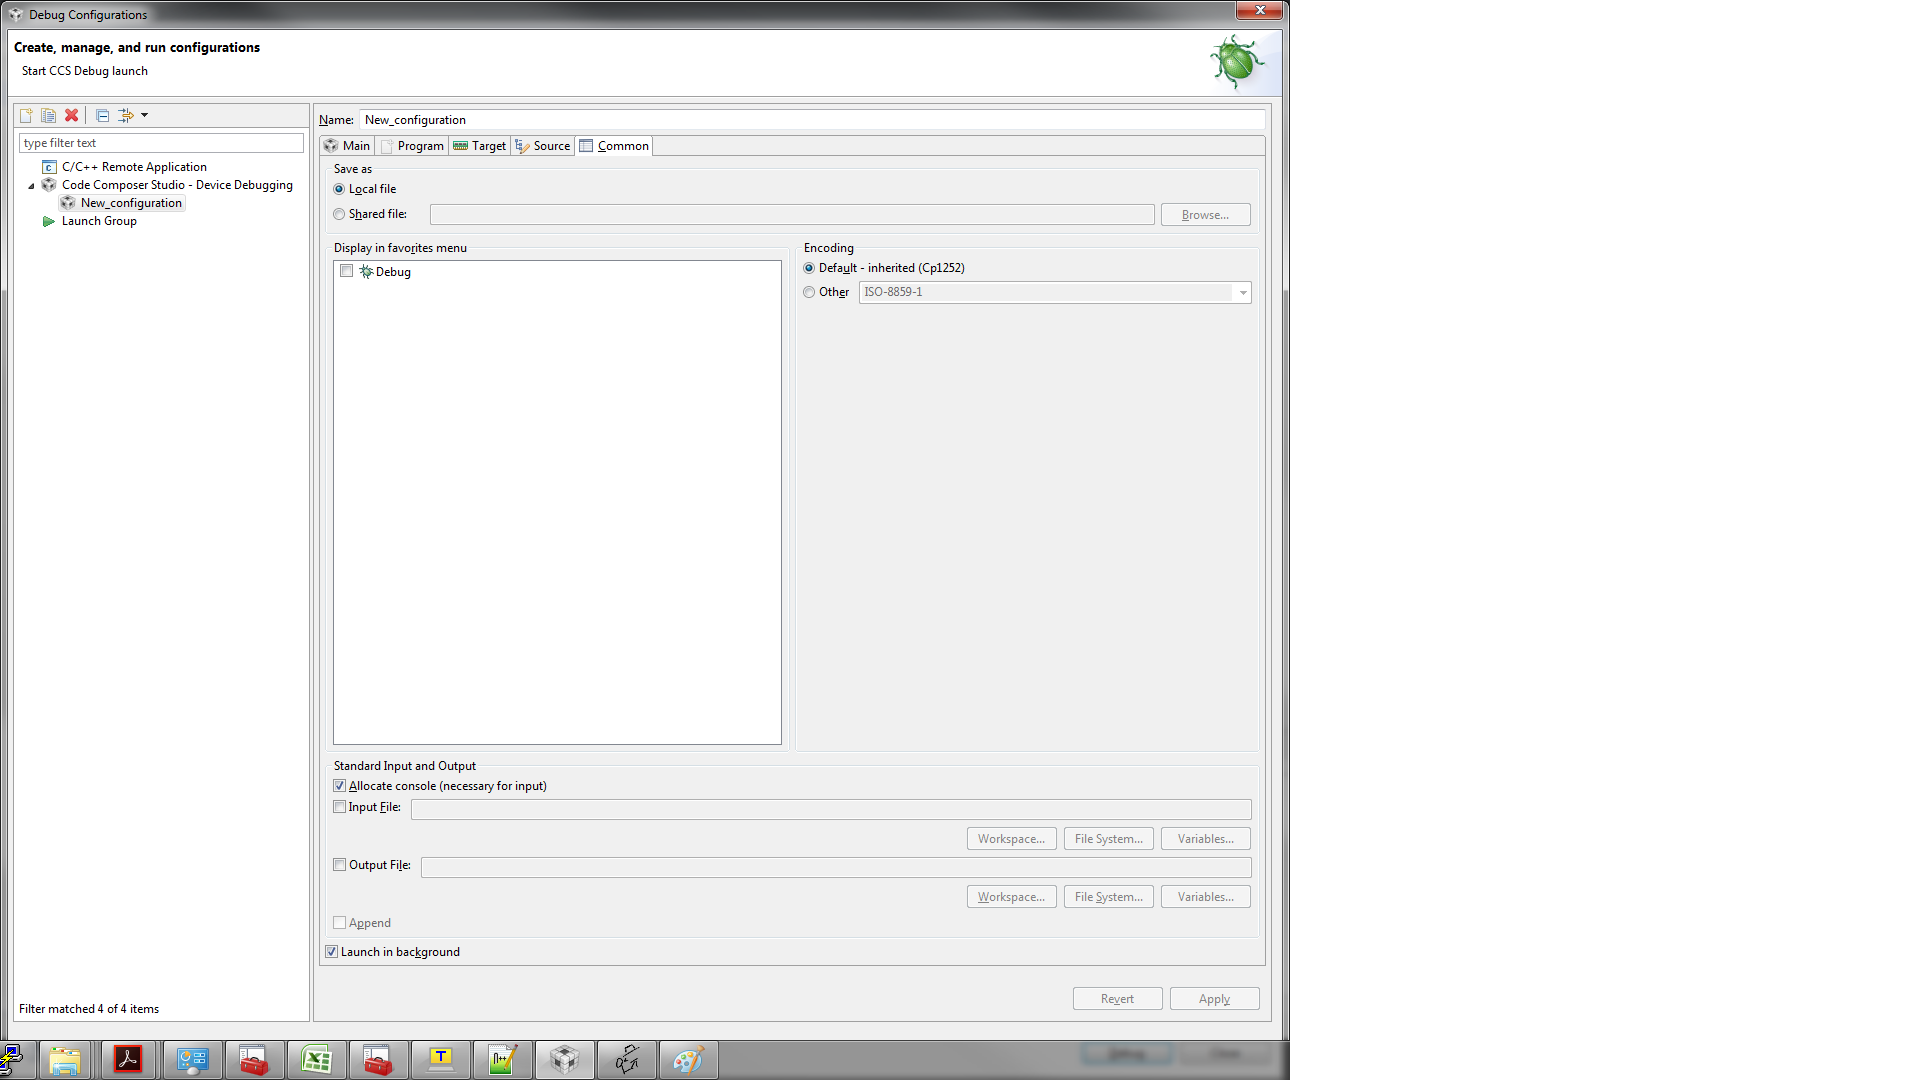
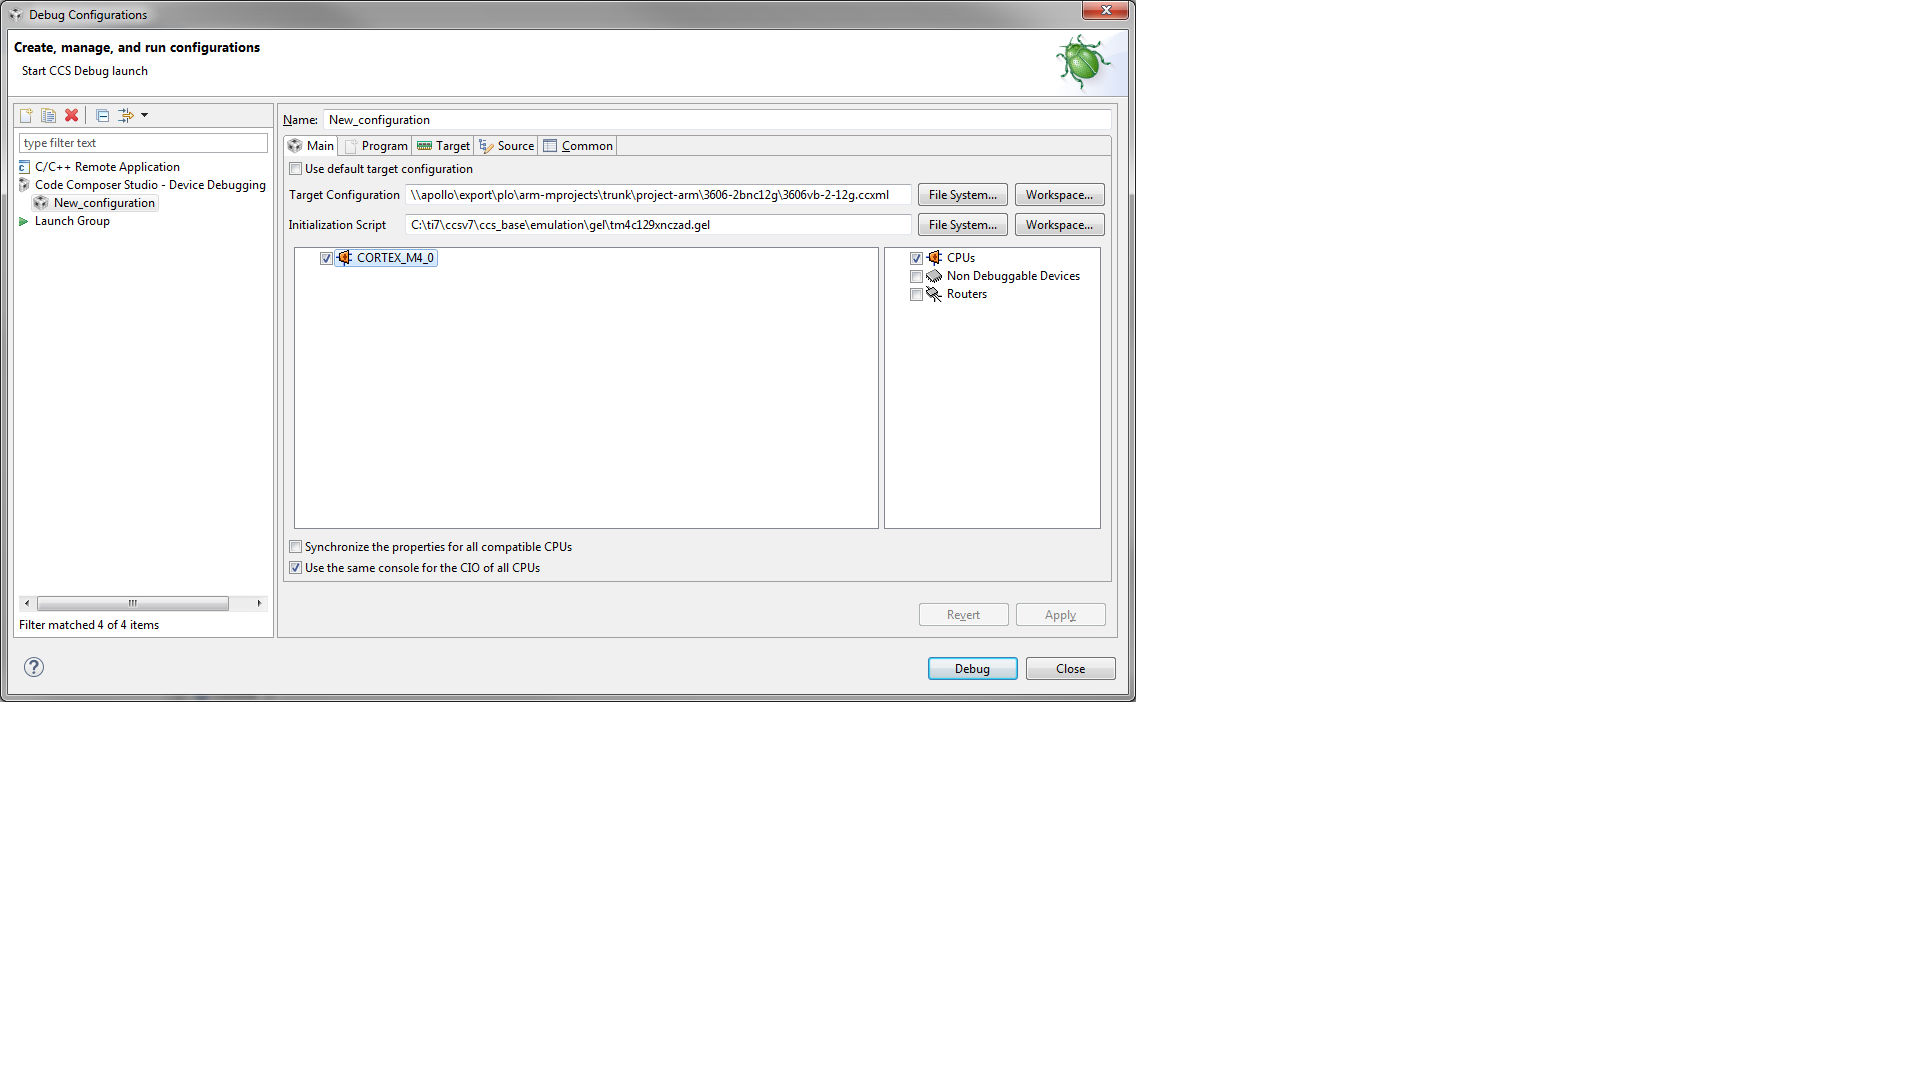
A debug configuration is created with the following settings:

  • Forgot to mention here are the gcc/g++ compiler options used for debugging:
    CFLAGS+=-g3 -D DEBUG_MODE -O0 -fno-inline
    CPPFLAGS+=-g3 -D DEBUG_MODE -O0 -fno-inline
  • Hi Peter,
    The below video explains the message and some potential causes:
    www.youtube.com/watch

    In you case, the debugger is unable to associate the source files in your project with the loaded debug symbols. This is likely because, as you mentioned, you are building outside of CCS on an external server. The debug symbols likely has path information to source files based on the directly structure of the build environment. When you load the elf file, you will need to make sure the debug source search paths are set up so that the debugger can find them. You do have a project with the source files linked, so i would expect the debugger to be able to find them. But it does not seem to be the case. You mentioned some useful screenshots, but it doesn't seem like they got posted correctly. Can you repost them? Also, a reproducible test case (source + elf file) would be very useful.

    Thanks
    ki
  • because of the nature of the error message (No source available for <address>), it looks like there is no source code correlation with that address in the loaded debug symbols. My first question is: what source file does that address (0xeb14) correlate to?

    It would be very helpful to obtain the elf executable you are loading. Can you provide that?
  • Hello Ki-Soo,

    Thank you for the reply.  I've included the screen shots in a separate post below.  As you can see I've created a project which links to the source files.  I am able to navigate to the source files through the project browser.  

    I am not able to send the source since it is large project, but if needed i could create a small sample project perhaps.  How do I go about sending you the .elf file?  I have tried attaching it to this post but failed.

  • Maybe for now, just the elf file is enough. If you are having issues attaching the elf file to this thread, perhaps you can pass it on to Chris Yorkey, whom I believe you have been in contact with. He can pass it on to me (he is away of this thread)

    Thanks
    ki
  • nevermind, I see you attached it. Thanks!
  • Interestingly, when I halt at 0xeb14, I see:

    I have the option to locate the tasks.c file in my tivaware installation. I'm surprised you did not get the same message.

    In your screenshot regarding no source at 0xeb14, when did that message occur? I see that your target is running in your screenshot, so it must have happened earlier. Is that what you saw when you connected to the target but before you loaded the program? What happens when you halt the target now?

  • Hello Ki-Soo,

    Unfortunately I do not have that option when I pause execution.  I only have the option to "View Dissassembly".

    The version of code composer studio I am running is this:  Version: 7.0.0.00043

  • The symbolic information is in the elf file, i'm not sure why you do not see it. You are loading the elf files via "Load Program", correct?

    Open the Modules View (View -> Modules) and expand the functions node. Can you find prvCheckTasksWaitingTermination()?

  •  Hello Ki-Soo,

    I assumed that the .elf was loaded upon starting of the debug session.  When I manually loaded the .ELF (using hte run->load->Load Program) after starting the debug session I am faced with a different problem.  Attached is a screen shot of the issue. 

    This occured after the following sequence:

    1. Manually load the .ELF

    2. code composer studio automatically started executing the instructions.

    3. I pause debug and the disassembly indicated that the pc was at 0xffffffe.

    4. I've done a recompile so attached is the new .elf file.https://e2e.ti.com/cfs-file/__key/communityserver-discussions-components-files/81/1070.3606VB_2D00_2_2D00_12G.7z

  • peter lo1 said:
    I assumed that the .elf was loaded upon starting of the debug session.  When I manually loaded the .ELF (using hte run->load->Load Program) after starting the debug session I am faced with a different problem.  Attached is a screen shot of the issue. 

    How are you launching a debug session? If you are doing a project-less debug session (launching a debug session via using a target configuration file directly), then you would need to load the program. Note that if the program has already been flashed to the target, then you can use the option to Load Symbols instead since the code is already on the target.

    peter lo1 said:
    3. I pause debug and the disassembly indicated that the pc was at 0xffffffe.

    That address does not look like a valid address for the PC to be at. Looks like some exception was hit or the code ran off into the weeds. I don't have a good explanation for that.

    yYou mentioned that it was running fine before. It sounds the code had be flashed successfully on the target before you tried connecting to CCS. Can you explain in detail your environment? How did you get the code on the target previously? Via CCS load program?

  • Hello Si-Koo,

    1. Yes I am launching the debug session via the target configuration file directly.  I have also disabled auto connect when launch occurs.

    2. When the code was running before I had manually loaded the binary file using lmflashprogrammer before hand. 

    So I have found a hack fix to get this to work, but  I am wondering why I cannot successfully load / runthe .ELF file using the "Load Program" function within the code composer IDE.

    In order to successfully be able to view the .c source code while running the debugger I selected the option to "Load symbols only" as you suggested, but first I programmed the target device manually with the .bin file using lmflashprogrammer.

    I would like to use code composer studio directly to load the .elf file, but when I do so, the program counter run off into the weeds at 0xffffffe, when the application is running.. 

  • peter lo1 said:
    I would like to use code composer studio directly to load the .elf file, but when I do so, the program counter run off into the weeds at 0xffffffe, when the application is running..

    Since you are using GCC you might be encountering the Known issue when using CCS 6.1/Linaro GCC 4.8.4 which causes CCS to start the program running from an incorrect entry address when starting a debug session.

    Try applying one of the workarounds in the referenced WIki page.

  • Chester Gillon said:
    Since you are using GCC you might be encountering the Known issue when using CCS 6.1/Linaro GCC 4.8.4 which causes CCS to start the program running from an incorrect entry address when starting a debug session.

    Having just created a new project for a TM4C1294NCPDT in CCS 7.0.0.00042 using GNU compiler v4.9.3, upon starting a debug session main wasn't reached and when suspended the program counter was 0xfffffffe.

    Applying the work-around of adding the following to the tm4c1294ncpdt.lds linker script then allowed main to be reached when starting a debug session:

    ENTRY(ResetISR)

    ENTRY(ResetISR)

  • Thank you Chester.  I will give that a try and follow up with you guys once I do.