This thread has been locked.

If you have a related question, please click the "Ask a related question" button in the top right corner. The newly created question will be automatically linked to this question.

CCS: How can I debug multiple launchpads simultaneously with CCS?

Other Parts Discussed in Thread: CC1310, LAUNCHXL-CC1310

Tool/software: Code Composer Studio

Hi,

I'm trying to debug a mesh radio project which involves multiple launchpads all running exactly the same code with CCS, but it won't let me have more than one instance running.

If I open another instance, it complains that the workspace is in use, then simply shows an empty window with a close button that doesn't work. image

I can't get the first instance to use another workspace either, there's only one listed and when I select 'File -> Switch Workspace -> Other...' nothing happens - the menu vanishes and CCS apparently ignores that I selected that menu item.

I'm already using another editor and CCS picks up external changes to the files just fine, why does it have this restriction on workspaces?

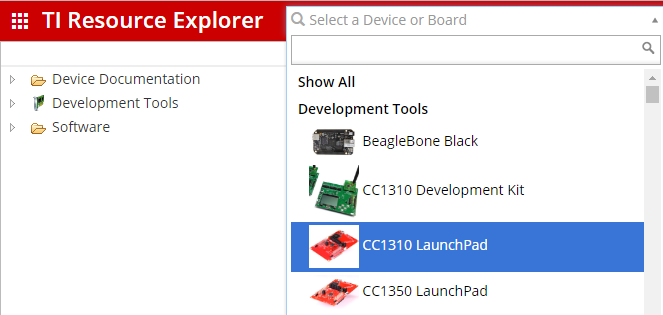
Furthermore, I can't find a way to select a specific launchpad in CCS. SmartRF studio seems to have this ability, why not CCS?

How can I debug multiple launchpads at once, all running the same code?

ps: why is the Part Number field saying 'Part number "LAUNCHXL-CC1310" not recognized.' ? It suggests that entry when I write cc1310...

  • I found processors.wiki.ti.com/.../Multi-Core_Debug_with_CCS but apparently the new window won't load any code and it's slaved to the first window, so not much help with this.

    I also encountered an annoying UI bug with CCS when exploring this option, the two windows keep trying to be on top when they receive focus which means I can't have one restored and one maximized without the maximized one covering the restored one when I move my mouse pointer around. Also, it only does this between the CCS windows, it won't cover other applications' windows when gaining focus - only other CCS windows. Why is CCS manipulating the window drawing order? That's my window and task manager's job...
  • processors.wiki.ti.com/.../Multi-Emulator_Debug_with_CCS seems to be the ticket! Took me ages to find, nothing I was googling seemed to bring it up, stumbled in there from some other article that linked to it.
  • I've worked out how to configure CCS to program both boards at once, however the second board always throws a verification error at 0x8000. If I flash the boards individually (with exactly the same image), both always succeed.

    Any ideas why that might be?
  • Michael,

    It is possible to have CCS connect to multiple LaunchPads or to a specific LaunchPad.  The trick is basically setting the serial number of the LaunchPad so that CCS can identify it.

    This video shows how to do it for 2 LaunchPads that have XDS100 debug probes on them but the process is basically the same for CC1310 which has an XDS110.

    As far as the part number not being recognized, where is that happening.  When creating a project or target configuration in general CCS wants the chip name.  If I type in CC1310 I should get results that look like this:

    Resource Explorer on the other hand has a lot of content that is specific to the board and should accept the board name.  I think this may be where you are seeing the issue.  If I enter CC1310 in the filter box I see an selection for the LaunchPad but if I put in the part number of the LaunchPad I don't.

    Try selecting the CC1310 LaunchPad.

    Regards,

    John

  • Sorry about that. When I was viewing the thread it didn't show the other replys. E2E seems to have gremlins today. Did you get past the data verification error?
  • No, I decided that the choice between 1) only debugging one launchpad and 2) having to manually specify the serial number for each device (and having it fail anyway) was too cumbersome - what I really want is an option to find any /n/ launchpads, flash them all and then show console output from all of them.

    I haven't found an easier way to flash them than plugging/unplugging them one by one, but with UART console I can monitor them all simultaneously with ease using just gnu screen and cat.

    If I could find a terminal app that could show the debug console over JTAG like CCS itself does (and lets me specify which one to connect to), that would be fantastic - the end application is using the 4x4 RSM package variant which doesn't have enough spare GPIO for UART (all the pins are used for external chips), so I can't monitor the console on the target boards - only launchpads running the same code and with target hardware hooked to the GPIO.

    It's trivial enough to enumerate available serial numbers using udev or lsusb, just need something non-graphical that I can programmatically feed them to!

    ps: I wish the toolchain had an easier way to switch pinouts/package variants, at the moment I have to change things in multiple places (CC1310_LAUNCHXL.h, SCS, Board.h, etc) to switch from launchpad (7x7 RGZ) to target board (4x4 RSM)