This thread has been locked.

If you have a related question, please click the "Ask a related question" button in the top right corner. The newly created question will be automatically linked to this question.

CCS/TM4C129ENCZAD: Trying to debug design crash running QSSI and TIRTOS

Part Number: TM4C129ENCZAD
Other Parts Discussed in Thread: SYSBIOS, , EK-TM4C1294XL

Tool/software: Code Composer Studio

HI,

We started out building a design that reads data from an external device using SPI. The data is written into on-board SRAM from the TM4C129 uC. This has worked flawlessly.

Meanwhile, with help from this forum, got a revised version of this design working that replaces SPI with QSSI, (and removes temporarily a separate task that sent the data to an external host).  QSSI data from the external data source is transferred into a uint32_t type (called rcv_data). Running in debug mode, stepping thru the while(1) loop that contains the QSSI read commands (see code below), and watching the rcv_data variable, the correct data is always returned and everything is ok. However, when I remove the breakpoint in that loop and just tell it to run, the design crashes. At this point,  the data isn't going any where. The last value is overwritten by the next value (as mentioned above, the task that sent this data to a host was removed to simplify debugging).

I've been reading thru the following doc, Diagnosing Software Faults in Stellaris® Microcontrollers (AN01286–May 2012), and looking at the various ROV and Disassembly and memory views, based on the contents of the PC, LR, PSR, NVIC reg, etc.

The crash appears to happen in the same place with each run.

The crash appears to happen in the same place each time this is run.

The debug session goes kind of as follows:

Stepping thru the startup/init sequence, end up in switchFromBootStack__E. If I don’t step into that, the design commences to run. Stepping in, reach Hwi_switchFromBootStack(), followed by,

/* start first task by way of enter() */

   Task_SupportProxy_swap((Ptr)&prevTask->context,

               (Ptr)&Task_module->curTask->context);

Stepping into that takes you to the following,

/* swap__E */

xdc_Void ti_sysbios_knl_Task_SupportProxy_swap__E( xdc_Ptr *oldtskContext, xdc_Ptr *newtskContext )

{

   ti_sysbios_family_arm_m3_TaskSupport_swap(oldtskContext, newtskContext);

}

From there, jumps to the while(1) loop in CmdH, at line SSIDataPut.

Before crash, afer a couple of xfers, ROV Task – Detailed view:

And ROV Task – Call Stacks:

And HWI – Detailed:

Now tell it to just go.


Note that while(1) loop where the QSSI xfers are done, has a wait() between the two consecutive calls. Without that wait, the crash is almost immediate. With the wait, in the debug environment, but free-running, takes ~10 min to crash.

Crash report in console:

[CORTEX_M4_0] baud_rate :   98968

Returned: 0

ti.sysbios.family.arm.m3.Hwi: line 1095: E_hardFault: FORCED

ti.sysbios.family.arm.m3.Hwi: line 1172: E_busFault: PRECISERR: Immediate Bus Fault, exact addr known, address: 1ad05c95

Exception occurred in background thread at PC = 0x000058dc.

Core 0: Exception occurred in ThreadType_Task.

Task name: {unknown-instance-name}, handle: 0x200003a8.

Task stack base: 0x200003f8.

Task stack size: 0x200.

R0 = 0x20001fb8 R8 = 0x00000001

R1 = 0x0000fdc4 R9 = 0x00000064

R2 = 0x00000020 R10 = 0x00000000

R3 = 0x1ad00300 R11 = 0x00000020

R4 = 0x0000ad00 R12 = 0x1b260200

R5 = 0x00005995 SP(R13) = 0x20000548

R6 = 0x20003020 LR(R14) = 0x000082e3

R7 = 0x00000000 PC(R15) = 0x000058dc

PSR = 0x81001800

ICSR = 0x00423803

MMFSR = 0x00

BFSR = 0x82

UFSR = 0x0000

HFSR = 0x40000000

DFSR = 0x00000001

MMAR = 0x1ad05c95

BFAR = 0x1ad05c95

AFSR = 0x00000000

Terminating execution...

Last function called at crash, in exit.c, line 54:

   static void loader_exit(void)

Looking at ROV Task – Detailed:

ROV Task – Call Stack:

HWI Detailed:

Crash returned PC:

Crash returned LR in Disassembly:

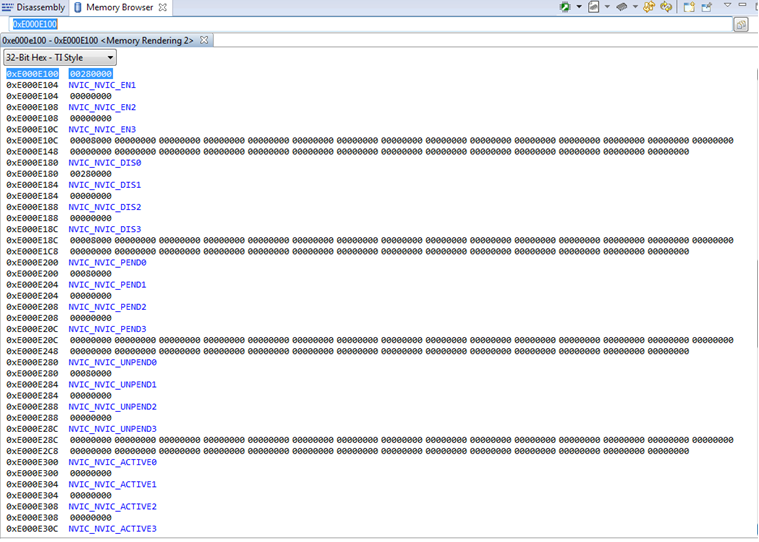
Memory View showing first portion of NVIC (0xE100_E100 in memory view).

Fault stat value is 0x00008200 – bits (15:8) = Bus Fault = 1000_0010.

Breakdown of bits that may be interesting:

Bit 15 = 1 – valid fault address

Bit 12 = 0 – No fault has occurred on stacking for exception entry.

Bit 11 = 0 – No fault has occurred on unstacking for a return from exception

Bit 9 – 1 - A data bus error has occurred, and the PC value stacked for the exception return points to the instruction that caused the fault.

Page 7 of the diagnosing doc (referenced above) states for this fault value, the Bus Fault Address register contains the exact value of the address that triggered the bus fault. Looking at that address, 0xE000.ED38,

Fault Address I’m assuming is the first 32 bits in the above output, 0x1AD05C95(?). This supposedly is the address of the instruction that caused the hard bus fault; it matches that reported in the crash dump message.

Looking at that addr in the Dissassembly view:

Referring the Memory Model map (p. 109) in the uC UG, any addr in the range 0x300_0000 to 0x1FFF_FFFF is Reserved.

So, I’m kind of lost at this point. I am not connecting the dots here at all. Hoping someone can take a look at this and see where I need to poke next to figure out where the code is failing.

Thank you.

  • erik skullerude said:
    Fault Address I’m assuming is the first 32 bits in the above output, 0x1AD05C95(?). This supposedly is the address of the instruction that caused the hard bus fault; it matches that reported in the crash dump message.

    The Fault Address is the address which generated the bus fault when it was attempted to be accessed.

    The address of the instruction which caused the bus fault is listed by the PC in the exception trace reported in the console, which in your case was PC(R15) = 0x000058dc.

    Also, if you look in the ROV view under Hwi -> Exception you should see an Exception call stack which shows the call stack leading to the instruction which generated the exception.

  • Hi,

    Thank you for the quick reply. Looked that the following for the PC addr:

    Disassembly view:

    which if I interpret correctly, is the Hwi_restore(key) function call?

    Hwi Call Stack:

    So appears the crash wiped out  the Hwi Exception info?

    What does  "Can't use 'in' on a non-object' mean (Google search turned up nothing on this message)?

    The Hwi_Restore(key) arg 'key' appears to be generated by a Hwi_Disable call. Is it possible the 'key' arg is bogus somehow?

    Thanks again for the help.

  • erik skullerude said:
    which if I interpret correctly, is the Hwi_restore(key) function call?

    The CCS disassembly view shows the corresponding source statement before the instruction(s) which form the statement. That means the instruction at address 0x58dc is actually for the GPIOTiva_config.callbacks[index] = callback; statement.

    erik skullerude said:
    So appears the crash wiped out  the Hwi Exception info?

    What does  "Can't use 'in' on a non-object' mean (Google search turned up nothing on this message)?

    I think the "Can't use 'in' on a non-object" is an internal error in the ROV software used to pass the exception information, and I also failed to find the meaning of that. A forum search found several cases of "Received exception from ROV server:" but not clear if that can be caused by corruption to memory on the target.

    After the exception has occurred you could try the Exception Dump Decoding Using the CCS Register View to make the CCS Debug view show the call stack at the exception, by pasting the PC, SP and LR values from the exception dump to the Core Registers.

  • erik skullerude said:
    Crash returned PC:

    Crash returned LR in Disassembly:

    The reported PC and LR exception register values don't appear consistent. The PC is in the GPIO_setCallback() function and the LR is in the xdc_runtime_Timestamp_SupportProxy_get_64__E() function. Where from the source code the xdc_runtime_Timestamp_SupportProxy_get_64__E() function doesn't call the GPIO_setCallback() function.

    Therefore, maybe the stack has become corrupted. After the exception has occurred, does the ROV Task -> Detailed view report if any stack overflows have occurred?

    Also, what errors does the ROV BIOS -> Scan for errors view show?

  • Re. using the Exception Dump Decoding Using the CCS Register View to recreate the stack at the exception, the following screen capture shows what the outcome is:


    Not sure if this was a success or not - reports no symbols are defined - is this just an artifact of the debugger or is this trying to tell me there is a code problem?

    Side Note: I made a change in the infinite while loop where the qssi reads execute. Removed a wait statement (that was inserted to slow down the loop) and then added a Systemprintf to report every 1000'th read value (returned from the qssi read).  Possibly why the crash dump is different than the previous one I posted(?).

    Still not seeing connection to where the source code is failing.

    Re. ROV Task - Detailed, this is what is there post-crash:

    Any other suggestions?

    Thank you again for all the help. At least I'm learning a bit more about interpreting the debug output (a lot harder than I thought it would be)

  • There was a leftover sdram_main() init function call in main, that didn't need to be active since in this build I'm test with, have the sdram removed. After commenting out sdram_main(), the application will run for ~5 or 6 min at full speed (no wait()'s, above referenced counters removed; in the debug view, just tell it to Go. When it finally crashes, this is what i see;

    Crash dump in Console:

    [CORTEX_M4_0] baud_rate :   98968

    Returned: fffffff7

    ti.sysbios.family.arm.m3.Hwi: line 1095: E_hardFault: FORCED

    ti.sysbios.family.arm.m3.Hwi: line 1172: E_busFault: PRECISERR: Immediate Bus Fault, exact addr known, address: f6dd045d

    Exception occurred in background thread at PC = 0x0000608a.

    Core 0: Exception occurred in ThreadType_Task.

    Task name: {unknown-instance-name}, handle: 0x20000710.

    Task stack base: 0x20000760.

    Task stack size: 0x400.

    R0 = 0xf6dd045d         R8 = 0xffffffff

    R1 = 0x2000529c        R9 = 0xffffffff

    R2 = 0x00000000        R10 = 0xffffffff

    R3 = 0x00000000        R11 = 0xffffffff

    R4 = 0x20004550        R12 = 0x1a230300

    R5 = 0x00000000        SP(R13) = 0x20003e90

    R6 = 0x000000f8         LR(R14) = 0x00004453

    R7 = 0xffffffff                  PC(R15) = 0x0000608a

    PSR = 0x81000000

    ICSR = 0x00423803

    MMFSR = 0x00

    BFSR = 0x82

    UFSR = 0x0000

    HFSR = 0x40000000

    DFSR = 0x00000001

    MMAR = 0xf6dd045d

    BFAR = 0xf6dd045d

    AFSR = 0x00000000

    Terminating execution...

    ROV Task - Detailed:

    ROV Task - Stack:

    Symbol is not available?

    ROV BIOS - Scan for Errors:

    Cannot read property enabled from null?

    Disassembly – at PC:

    Scrolling the above window up a few dozen lines, I see the following line:

       ti_sysbios_knl_Swi_restoreHwi__E():

         00006048:   B570               push       {r4, r5, r6, lr}

         0000604a:   BB78               cbnz       r0, #0x60ac

     Not sure yet where or what this is.

    Disassembly - SP:

    All those F’s don’t look good?

    Disassembly LR:

    Hoping there is some useful clues here - will take another look in the morning. Any suggestions appreciated.

  • It sort of looks like from above the crash is occuring in code that handles task switching(?).
    Currently there are two tasks, a heartbeat (priority 10) and QSSI_Test (priority 1).

    I took out the heartbeat task. The qssi test runs at full speed without crashing - ran for ~40 min (wow).

    Not sure yet what to look for in this regard. Doesn't this task switching all get done by the OS? What does the user application have to do so that tasks switching is not a problem (not even sure I'm asking and intelligent question here...)?
  • erik skullerude said:
    Re. using the Exception Dump Decoding Using the CCS Register View to recreate the stack at the exception, the following screen capture shows what the outcome is:

    Not sure if this was a success or not - I see reference to Hwi_Object. Is this what I should expect?  Next line reports no symbols are defined - is this just an artifact of the debugger or is this trying to tell me there is a code problem?

    From looking at the screen shot, only the value of the PC has been copied from the exception dump to the Core Registers. For the backtrace in the Debug view to be complete the value of the SP and LR also need to be copied from the exception dump to the Core Registers.

    The "No symbols are defined" is for address 0x200003a8 which is RAM, and may be a side effect of the SP and LR register values from the exception dump not being copied from to the Core Registers; since the SP and LR register values are required to follow the backtrace.

  • erik skullerude said:
    Disassembly - SP:

    All those F’s don’t look good?

    The SP points at RAM used for the stack, which is for local variables rather than executable code. Therefore, it is expected that disassembling the stack will show invalid instructions.

    Having all F's on the stack doesn't necessarily indicate a problem; it depends what those addresses are used for.

  • erik skullerude said:
    Not sure yet what to look for in this regard. Doesn't this task switching all get done by the OS? What does the user application have to do so that tasks switching is not a problem (not even sure I'm asking and intelligent question here...)?

    Yes, the task switching does get done by the OS.

    Given the intermittent crashes you have been having not sure if have an application bug overwriting some memory it shouldn't do, have found a bug in TI-RTOS, or have a hardware problem.

    Some questions about your environment:

    1) Are you using a TI EVM or a custom board?

    [Given the mention of a TM4C129ENCZAD I assume a custom board is in use]

    2) Which version of TI-RTOS is being used?

    3) Which compiler is being used?

    4) Which version of CCS is being used?

    5) Do have more than one board to try, and if so do all board show a crash?

    6) Are you able to post the project which shows the problem?

    Some suggestions:

    7) In the .cfg file under "SYS/BIOS - Clocking Options" can you check that the Clock Configuration has been set correctly to match your hardware.

    E.g. if the Crystal value specified in the SYS/BIOS clock configuration doesn't match the actual crystal value on the hardware the device may be over-clocked which can lead to intermittent operation.

    8) The debugger screen shots show a XDS200 emulator is being used which has support for SWO trace. If you enable the Statistical Function Profiling Configuration or Interrupt Profiling Configuration that may highlight an anomaly in the application execution prior to the crash. See the Trace Analyzer User’s Guide.

  • Re. screen shot, appears I posted the wrong screen shot. I just edited the original post with the intended screen showing the PC, SP, LR registers set to the values in the crash dump. The resultant debug window only shows "No symbols are defined" for the PC address.
  • Hi,

    Replies to above quesitons:
    1) custom board.
    2) TI RTOS version - tirtos_tivac_2_16_01_14
    3) Compiler ver. TI v16.9.1.LTS [TI v16.9.0.LTS] (from the CCS General - Main in Project Properties).
    4) Version: 7.0.0.00043
    5) We have two revs of this custom board. Both exhibit the same behavior.
    6) Will post later today.
    7) Right now, using the on-board crystal. See screen capture below of clock config.
    8) Will try SWO trace this evening.

    Clock config:

    Why is the Computed CPU freq 120MHz when the value used for setting QSSI freq is 100MHz???

    In main.c, there is the following sequence to set up qssi clocking:

       SysCtlClockFreqSet(SYSCTL_OSC_INT, SYSCTL_SYSDIV_1 | SYSCTL_USE_PLL );
       clock = SysCtlClockGet();
       baud_rate = clock >> 4u;
       System_printf("baud_rate :   %x\n", baud_rate);

    Parameter  'baud_rate'  reports 6250000, which is 100MHz/16.  This conflicts with above reported CPU freq of 120MHz, doesn't it?

    Thank you again.

  • erik skullerude said:
    I just edited the original post with the intended screen showing the PC, SP, LR registers set to the values in the crash dump. The resultant debug window only shows "No symbols are defined" for the PC address.

    OK, the update screen shot shows the reported PC value is in SRAM. I think this means the PC value reported in the exception dump isn't valid; the displayed disassembly doesn't look like valid code due to the number of "movs r0,r0" instructions for the value 0000.

    [Well, it is possible to copy code to SRAM to execute but if that happened the CCS debugger should be able to obtain the symbolic addresses and the code would look reasonable]

  • I posted answers to the above question, but something went wrong during the posting. I deleted that reply and did a second one. On submit, got a message the reply must be moderated before post. So I don't know what the state of that reply is. I can repost - please advice.

    Meanwhile, the following is the code.

    Thank you.

    //following code is from main.c


    int main(void)

    {

    void Board_initQSSI(uint32_t, uint32_t, bool);


    volatile uint32_t clock;

    uint32_t baud_rate; // = QSSI_BAUDRATE;


    sdram_main();


    InitGPIO();

    //InitSpi();

    InitUART();

    SysCtlClockFreqSet(SYSCTL_OSC_INT, SYSCTL_SYSDIV_1 | SYSCTL_USE_PLL );

    clock = SysCtlClockGet();

    baud_rate = clock >> 4u;

    System_printf("baud_rate : %x\n", baud_rate);

    Board_initQSSI(clock, baud_rate, 0); //set up qssi interface


    GPIOPinWrite(RED_LED_OFF);

    GPIOPinWrite(GREEN_LED_OFF);

    wait(100);


    InitHeartbeatTask();

    InitQssiTestTask();

    BIOS_start();


    return 0;

    }


    void InitHeartbeatTask()

    {

    Task_Handle taskHandle;

    Task_Params taskParams;

    Error_Block eb;

    Error_init(&eb);

    Task_Params_init(&taskParams);

    taskParams.stackSize = 512;

    taskParams.priority = 10;


    taskHandle = Task_create((Task_FuncPtr)HeartbeatTask, &taskParams, &eb);

    if (taskHandle == NULL)

    {


    }

    }


    void HeartbeatTask(UArg arg0, UArg arg1)

    {

    for(;;)

    {

    GPIOPinWrite(GPIO_PORTF_BASE, GPIO_PIN_1, GPIO_PIN_1);

    Task_sleep(100);


    GPIOPinWrite(GPIO_PORTF_BASE, GPIO_PIN_1, 0);

    Task_sleep(500);

    }

    }


    void InitQssiTestTask()

    {

    Task_Handle taskHandle;

    Task_Params taskParams;

    Error_Block eb;

    Error_init(&eb);

    Task_Params_init(&taskParams);

    taskParams.stackSize = 1024;

    taskParams.priority = 1;

    taskHandle = Task_create((Task_FuncPtr)Qssitest, &taskParams, &eb);


    if (taskHandle == NULL)

    {


    }

    }


    void InitUART(void)

    {

    SysCtlPeripheralEnable(SYSCTL_PERIPH_GPIOA);

    SysCtlPeripheralEnable(SYSCTL_PERIPH_UART0);

    GPIOPinConfigure(GPIO_PA0_U0RX);

    GPIOPinConfigure(GPIO_PA1_U0TX);

    GPIOPinTypeUART(GPIO_PORTA_BASE, GPIO_PIN_0 | GPIO_PIN_1);

    UARTClockSourceSet(UART_BASE, UART_CLOCK_PIOSC);

    UARTStdioConfig(0, 115200, 16000000);

    }


    void InitGPIO()

    {

    SysCtlPeripheralEnable(SYSCTL_PERIPH_GPIOT); //hsync = PT0


    SysCtlPeripheralEnable(SYSCTL_PERIPH_GPIOF);

    GPIOPinTypeGPIOOutput(GPIO_PORTF_BASE, GPIO_RED_LED);

    GPIOPinTypeGPIOOutput(GPIO_PORTF_BASE, GPIO_GREEN_LED);

    //^leds


    GPIO_init();


    }


    void InitHeartbeatTask()

    {

    Task_Handle taskHandle;

    Task_Params taskParams;

    Error_Block eb;

    Error_init(&eb);

    Task_Params_init(&taskParams);

    taskParams.stackSize = 512;

    taskParams.priority = 10;


    taskHandle = Task_create((Task_FuncPtr)HeartbeatTask, &taskParams, &eb);

    if (taskHandle == NULL)

    {


    }

    }


    //following code is from qssi_test.c


    RETURN_CODE SendCommand(const Command_t command, const size_t expectedResponseLength)

    {

    static Uint8 responseBuffer[3];

    int i=0;

    UARTCharPut(UART_BASE, command);

    memset(responseBuffer, 0, 3);


    for(i=0; i< expectedResponseLength; i++)

    {

    responseBuffer[i] = (unsigned char)UARTCharGet(UART_BASE);

    }


    if (responseBuffer[0] != COMMAND_ACK)

    {

    return COMM_ERROR;

    }


    for (i=0; i<32768; i++){}


    return SUCCESS;


    }


    void Qssitest(UArg arg0, UArg arg1)

    {

    uint32_t rcv_data;

    RETURN_CODE retVal;


    retVal = SendCommandToDataSource(SET_MODE_TEST_PATTERN, 2); //UART command to data source

    if (retVal != CMD_SUCCESS)

    {

    //handle error

    }

    retVal = SendCommandToDataSource(START_DATA, 2);

    if (retVal != CMD_SUCCESS)

    {

    //handle error

    }

    System_printf("Returned: %x\n", retVal);

    wait();


    SSIAdvModeSet(SSI1_BASE, SSI_ADV_MODE_QUAD_READ);

    while(1)

    {

    SSIDataPut(SSI1_BASE, 0u); //dummy write to master to generate clocks

    SSIDataGet(SSI1_BASE, &rcv_data);

    wait();

    SSIDataPut(SSI1_BASE, 0u); //dummy write to master to generate clocks

    SSIDataGet(SSI1_BASE, &rcv_data);

    }


    //following code is from board_init.c


    void Board_initQSSI(uint32_t SysClk_Freq, uint32_t baud_rate, bool slave)

    {

    // Enable QSSI Peripherals

    if(slave==0) { //using ports B, D, E on QSSI1

    MAP_SysCtlPeripheralEnable(SYSCTL_PERIPH_SSI1);

    MAP_SysCtlPeripheralEnable(SYSCTL_PERIPH_GPIOB);

    MAP_SysCtlPeripheralEnable(SYSCTL_PERIPH_GPIOD);

    MAP_SysCtlPeripheralEnable(SYSCTL_PERIPH_GPIOE);

    }

    else { //using ports P, Q on QSSI3

    MAP_SysCtlPeripheralEnable(SYSCTL_PERIPH_SSI3);

    MAP_SysCtlPeripheralEnable(SYSCTL_PERIPH_GPIOP);

    MAP_SysCtlPeripheralEnable(SYSCTL_PERIPH_GPIOQ);

    }


    // Pin function via mux setting. This macro is mapped to GPIOPinConfigure in rom_map.h.

    // GPIOPinConfigure is def in gpio.c

    if(slave==0) { //using ports B, D, E on QSSI1

    MAP_GPIOPinConfigure(GPIO_PB5_SSI1CLK);

    MAP_GPIOPinConfigure(GPIO_PB4_SSI1FSS);

    MAP_GPIOPinConfigure(GPIO_PE4_SSI1XDAT0);

    MAP_GPIOPinConfigure(GPIO_PE5_SSI1XDAT1);

    MAP_GPIOPinConfigure(GPIO_PD4_SSI1XDAT2);

    MAP_GPIOPinConfigure(GPIO_PD5_SSI1XDAT3);

    }

    else { //using ports P, Q on QSSI3

    MAP_GPIOPinConfigure(GPIO_PQ0_SSI3CLK);

    MAP_GPIOPinConfigure(GPIO_PQ1_SSI3FSS);

    MAP_GPIOPinConfigure(GPIO_PQ2_SSI3XDAT0);

    MAP_GPIOPinConfigure(GPIO_PQ3_SSI3XDAT1);

    MAP_GPIOPinConfigure(GPIO_PP0_SSI3XDAT2);

    MAP_GPIOPinConfigure(GPIO_PP1_SSI3XDAT3);

    }

    // Pin operation settings. This macro is mapped to GPIOPinTypeSSI in rom_map.h.

    // GPIOPinTypeSSI is def in gpio.c

    if(slave==0) { //using ports B, D, E on QSSI1

    //MAP_GPIOPinTypeSSI(GPIO_PORTB_AHB_BASE, GPIO_PIN_5 | GPIO_PIN_4); //change per bi-ssi example

    MAP_GPIOPinTypeSSI(GPIO_PORTB_AHB_BASE, GPIO_PIN_4 | GPIO_PIN_5);

    MAP_GPIOPinTypeSSI(GPIO_PORTD_AHB_BASE, GPIO_PIN_4 | GPIO_PIN_5);

    MAP_GPIOPinTypeSSI(GPIO_PORTE_AHB_BASE, GPIO_PIN_4 | GPIO_PIN_5);

    }

    else { //using ports P, Q on QSSI3

    MAP_GPIOPinTypeSSI(GPIO_PORTP_BASE, GPIO_PIN_0 | GPIO_PIN_1);

    MAP_GPIOPinTypeSSI(GPIO_PORTQ_BASE, GPIO_PIN_0 | GPIO_PIN_1 | GPIO_PIN_2 | GPIO_PIN_3);

    }


    // Set to SPI Mode0 for QSSI (Advanced) mode; set master mode

    if(slave==0) {

    MAP_SSIConfigSetExpClk(SSI1_BASE, SysClk_Freq, SSI_FRF_MOTO_MODE_0, SSI_MODE_MASTER, baud_rate, 8);

    //SSIAdvModeSet(SSI1_BASE, SSI_ADV_MODE_QUAD_WRITE);

    SSIAdvModeSet(SSI1_BASE, SSI_ADV_MODE_QUAD_READ);

    }

    else {

    SSIConfigSetExpClk(SSI3_BASE, SysClk_Freq, SSI_FRF_MOTO_MODE_0, SSI_MODE_SLAVE, baud_rate, 8);

    SSIAdvModeSet(SSI3_BASE, SSI_ADV_MODE_QUAD_READ);

    SSIDataPut(SSI3_BASE, 0x4000); //dummy write to get clock running to config slave

    }

    // Enable QSSI

    if(slave==0) {

    MAP_SSIEnable(SSI1_BASE);

    }

    else {

    MAP_SSIEnable(SSI3_BASE);

    }


    }


  • erik skullerude said:
    I deleted that reply and did a second one. On submit, got a message the reply must be moderated before post. So I don't know what the state of that reply is. I can repost - please advice.

    The moderated reply isn't visible yet, so best that you repost.

    [I did get an email with the first reply, but it was missing the information about the clock setup]

    erik skullerude said:
    SysCtlClockFreqSet(SYSCTL_OSC_INT, SYSCTL_SYSDIV_1 | SYSCTL_USE_PLL );

    clock = SysCtlClockGet();

    baud_rate = clock >> 4u;

    In that fragment of code the second arguments SysCtlClockFreqSet() look incorrect. The second argument is supposed to be the desired clock frequency in Hz, but the expression SYSCTL_SYSDIV_1 | SYSCTL_USE_PLL has been used. SYSCTL_SYSDIV_1 and SYSCTL_USE_PLL bit mask options which are supposed to used in the first argument to SysCtlClockFreqSet().

    The expression SYSCTL_SYSDIV_1 | SYSCTL_USE_PLL evaluates to 125,829,120 Hz which is 4% higher that the maximum allowed TM4C129 clock frequency of 120 MHz.

    When TI-RTOS is used the clock configuration is set during startup according to the settings on the "SYS/BIOS - Clocking Options" screen of the XGCONF editor. I suggest ensuring that the "SYS/BIOS - Clocking Options" is set according to the required clock configuration, and the SysCtlClockFreqSet() removed from main so that the clock is only set once. That might mean the calculation of the baud_rate in the main function needs to change.

    I will try and run the posted code on a TM4C129 launchpad to see if I can re-create the failure, and it removing the suspect SysCtlClockFreqSet() call in main then makes the problem go away. 

  • Re-Reply to your earlier questions, in same order you listed:

    1) custom board.

    2) TI RTOS version - tirtos_tivac_2_16_01_14

    3) Compiler ver. TI v16.9.1.LTS [TI v16.9.0.LTS] (from the CCS General - Main in Project Properties)

    4) Version: 7.0.0.00043

    5) We have two revs of this custom board. Both exhibit the same behavior.

    6) Will post later today (tied up right now...)

    7) Right now, using the on-board crystal. See screen capture below of clock config.

    8) Will try SWO trace this evening.

    Clock config:

    Why is the cpu clock showing 120MHz when its actually 100MHz?

  • I didn't include header files in the above listings:
    I will have to make up new header files as the ones I'm using are extensive with most content not applicable. I will do this in the morning when I get back in.
    The following lines added to a .h file may get you going tho:

    void wait(int);
    void HeartbeatTask(UArg arg0, UArg arg1);
    void InitQssiTestTask();

    #define GPIO_GREEN_LED (GPIO_PIN_2)
    #define GPIO_RED_LED (GPIO_PIN_1)

    #define GREEN_LED_ON GPIO_PORTF_BASE, GPIO_GREEN_LED, GPIO_GREEN_LED
    #define GREEN_LED_OFF GPIO_PORTF_BASE, GPIO_GREEN_LED, 0

    #define RED_LED_ON GPIO_PORTF_BASE, GPIO_RED_LED, GPIO_RED_LED
    #define RED_LED_OFF GPIO_PORTF_BASE, GPIO_RED_LED, 0

    #define SDRAM_START_ADDRESS 0x00000000
    #define SDRAM_END_ADDRESS 0x01FFFFFF

    // Number of bytes to use in SDRAM
    #define NUM_RAM_BYTES 16384


    #define UART_BASE UART0_BASE
    #define COMMAND_ACK 0x55
    #define COMMAND_NACK 0xAA
    #define COMM_ERROR = -9
    #define SUCCESS = 0
    #define CMD_SUCCESS = 0
    #define SET_MODE_TEST_PATTERN = 7
    #define START_DATA = 5

    typedef enum
    {
    START = 5,
    SET_MODE_TEST_PATTERN = 7,
    STOP = 8,
    TURN_LEDS_ON = 0xA,
    TURN_LEDS_OFF = 0xB,
    } Command_t;


    NOTE: The UART commands need to get a response. Maybe you can rig up a loopback for that?

    Its also way past my bedtime - I may not have a complete or meaningful list above but I think its close.

    Thank you again for all the help.
  • erik skullerude said:
    What does  "Can't use 'in' on a non-object' mean (Google search turned up nothing on this message)?

    I started trying to repeat your problem by importing the TI Drivers Example Empty Project for a EK-TM4C1294XL from TI-RTOS for Tiva C 2.16.01.14 and then adding your code. The program suffered an exception as soon at the program was set running.

    The ROV Hwi Exception view reported the same  "Can't use 'in' on a non-object" error:

    And there were some corrupt characters in the CIO Console, rather than an exception dump:

    The ROV Hwi Module view showed that the Hwi stack of size 768 bytes had overflowed:

    Therefore, I think a Hwi stack overflow is what is causing your exception dumps to report ROV view errors / have suspect PC values.

    In my .cfg file I increased the Hwi stack size by changing:

        Program.stack = 768;

    To:

        Program.stack = 4096;

    With the increase in the Hwi stack size to 4096 bytes the Hwi Exception view then showed a sensible call stack:

    And the Hwi Module view no longer showed a Hwi stack overflow:

    In my case the exception occurred in main during the GPIO initialization due to the way I had merged your code into the empty example.

    However, it shows that a Hwi stack overflow can cause an Exception not to be reported. i.e. suggest you set the value of Program.stack to at least 4096 bytes to try and get correct Exception views.

    Also, worth halting the program after a few seconds of execution and look at the ROV Hwi Module view to check no stack overflows have been reported since a stack overflow may lead to more obscure failures.

  • Hi,

    Viewing the .cfg file in text edit mode, this is what is there now:

    var Boot = xdc.useModule('ti.catalog.arm.cortexm4.tiva.ce.Boot');

    var BIOS = xdc.useModule('ti.sysbios.BIOS');

    var Config = xdc.useModule('ti.drivers.Config');

    var LoggingSetup = xdc.useModule('ti.uia.sysbios.LoggingSetup');

    var Semaphore = xdc.useModule('ti.sysbios.knl.Semaphore');

    Boot.oscSrc = Boot.OSCSRC_INT;

    Config.libType = Config.LibType_Instrumented;

    BIOS.libType = BIOS.LibType_Instrumented;

    BIOS.assertsEnabled = true;

    BIOS.logsEnabled = true;

    Boot.configureClock = false;

    var System = xdc.useModule('xdc.runtime.System');

    var SysStd = xdc.useModule('xdc.runtime.SysStd');

    System.SupportProxy = SysStd;

    In the CCS GUI, the RTOS Runtime view shows the following for stack size:

    Poking around the other views in the .cfg GUI pages, didn't see a specific setting for HWI stack size. Should I add the  'Program.stack = 4096' line to the .cfg file (via text editor)?

    Thanks again.

  • erik skullerude said:
    Poking around the other views in the .cfg GUI pages, didn't see a specific setting for HWI stack size. Should I add the  'Program.stack = 4096' line to the .cfg file (via text editor)?

    I found that the following all track the same value:

    - "System (Hwi and Swi) stack size" shown on the TI-RTOS ->Products > SYSBIOS -> BIOS - Basic Runtime Options GUI page

    - "Stack size" shown on the TI-RTOS -> Products -> SYSBIOS -> System -> Program - Runtime Sizes GUI page

    - Value of the Program.stack in the .cfg file script text.

    It looks like the default value is 4096, since if I delete the Program.stack line from the .cfg script text the stack value shown on the GUI pages changes to 4096.

    Therefore, think you already have the HWI stack size set to 4096. Suggest you check by running the program for a few seconds, then pause and look at the ROV Hwi -> Module view. The important thing to check is the hwiStackPeak .vs. hwiStackSize to see how much free space there is when the system is still operating correctly.

    Also, I tried running a program based upon your code fragments, and haven't seen any failures. However, the code for the wait() and SendCommandToDataSource() functions wasn't shown so I stubbed them. To avoid confusion, are you able to zip-up and post a complete project which shows the failure?

  • erik skullerude said:
    SysCtlClockFreqSet(SYSCTL_OSC_INT, SYSCTL_SYSDIV_1 | SYSCTL_USE_PLL );

    clock = SysCtlClockGet();

    baud_rate = clock >> 4u;

    System_printf("baud_rate : %x\n", baud_rate);

    Board_initQSSI(clock, baud_rate, 0); //set up qssi interface

    I have had another look at the clock set-up. I see from the Ti-RTOS "Boot - Clocking Options" that the "Automatically configure clock" option has been de-selected, which means that the SYS/BIOS doesn't configure the clock. i.e. it is only the SysCtlClockFreqSet() call in main which is setting the clock.

    As well as the previous comments about the second argument to SysCtlClockFreqSet() being the option flags SYSCTL_SYSDIV_1 | SYSCTL_USE_PLL rather than an actual frequency, the code is calling SysCtlClockGet() to get the actual clock frequency which has been set.

    The SysCtlClockGet() function is only for use on TM4C123 devices, for TM4C129 devices the actual clock frequency in use is that returned by the SysCtlClockFreqSet() function.

    I modified the main() function to report the clock frequency related values with the following code (I also change the baud_rate to be reported as decimal rather than hexadecimal for easier understanding):

        uint32_t actual_clock;
        uint32_t used_clock;
        uint32_t baud_rate; // = QSSI_BAUDRATE;
    
        actual_clock = SysCtlClockFreqSet(SYSCTL_OSC_INT, SYSCTL_SYSDIV_1 | SYSCTL_USE_PLL );
        used_clock = SysCtlClockGet();
        baud_rate = used_clock >> 4u;
        System_printf("actual_clock : %u\n", actual_clock);
        System_printf("used_clock : %u\n", used_clock);
        System_printf("baud_rate : %u\n", baud_rate);

    Which resulted in:

    actual_clock : 106666666
    used_clock : 10000000
    baud_rate : 625000

    This shows that the SysCtlClockFreqSet() function has set the actual clock frequency to 106,666,666 Hz, yet the clock frequency as returned by the incorrect call to SysCtlClockGet() is 10,000,000 Hz. This means that the actual clock frequency of the device is 10.666 times that of the clock frequency used for calculating the QSSI baud rate.

    What are the actual clock frequency and QSSI baud rate required by the application?

    These discrepancies in setting the clock frequency don't necessarily explain the crashes, but it may mean that the QSSI baud rate is higher than you expect.

  • Wow, so I'm really out in left field on this clock setup. Ultimately, we would like to get the QSSI running at 30Mbits/sec. The QSSI clock (from a master) has to be at least 2x the bit rate - 60MHz. To get that clock rate, will need the processor running at full 120MHz. For the initial testing, I'm not too concerned about bit rate; just want to get it working. You've provided a lot of info the past few days. I will sort thru this over the next 24 hr and let you know how it goes. I can upload the project at that point, if things are still not working.

    One question I have, I spent a little time searching thru the TM4C129 UG as well as the TR RTOS UG, for info on setting task priority. I don't think I've found the right document yet that details clearly what priority settings are higher vs. lower priority. In the TM4C129 UG, I found in the section on Register 61: System Handler Priority 1, it states 0 is highest priority, 7 is lowest (at this point in my search, I was just trying to track down info on priorities, not really understanding yet difference between hardware level and RTOS level).

    Then in the TIRTOS SysBios 6.4.6 UG, on p. 52, it states thread priorities (which I think is what we are dealing with here...), 0 is lowest, and numerically higher increase priority. As I have it set up now, the heartbeat is priority 10, and QSSI task is priority 1. Which is likely backwards from what it should be. I wonder if the qssi SSIDataGet command could cause a crash if it gets preempted by the higher priority heartbeat task?

    Thank you.

  • erik skullerude said:
    I was just trying to track down info on priorities, not really understanding yet difference between hardware level and RTOS level

    The TM4C129 section about System Handler Priorities is about the priorities of interrupts (exceptions) which are managed by the hardware.

    Wheres the task priorities as managed by the SYS/BIOS (TI-RTOS) software scheduler.

    Thus, these two types of priorities have different meanings; the SYS/BIOS (TI-RTOS) scheduler runs on different families of devices where the interrupt priorities are device family specific.

    erik skullerude said:
    I wonder if the qssi SSIDataGet command could cause a crash if it gets preempted by the higher priority heartbeat task?

    Looking at the source of the SSIDataGet() function it just waits for and reads an entry from the SSI fifo. Therefore, it should be able to be preempted by the heartbeat task without causing a crash.

  • Chester Gillon said:
    Given the intermittent crashes you have been having not sure if have an application bug overwriting some memory it shouldn't do, have found a bug in TI-RTOS, or have a hardware problem.

    In case it helps I created a simple "self test" program which left running to try and identify if the hardware is intermittent.

    The program sets the clock frequency to the maximum of 120 MHz and then repeatedly performs tests on the flash and SRAM by:

    a) Writing a test pattern to 90% of SRAM, which changes for every iteration.

    b) Verifying the contents of flash by using a CRC inserted by the linker, where the CRC hardware module is used to calculate the actual CRC which is compared against the expected CRC created by the linker.

    c) Checking a test pattern in 90% of flash.

    d) Checking the test pattern which was written to SRAM.

    The only external hardware resource required is one GPIO which is toggled at 1Hz to indicate the program is still running; the internal 16 MHz PIOSC is used for the clock source to avoid the need for an external crystal. Every minute the total number of test iterations to far is reported to the CCS CIO console, as another way of checking the program is still running. The program is a bare-metal example using TivaWare, and there are therefore no tasks or interrupts.

    A test failure will be reported by either:

    - The LED stops flashing if the program encounters a hard fault.

    - An error message in the CCS CIO console if the program is aborted after detecting an error in the test patterns in SRAM or flash, assuming the error allows the program to run for long enough to report the error as opposed to getting a hard fault.

    I have run the program on launchpads and haven't seen an errors when left running for up to 80 minutes. Example final output in the CIO console:

    After 77 minutes performed 35086 test iterations
    After 78 minutes performed 35544 test iterations
    After 79 minutes performed 36001 test iterations
    After 80 minutes performed 36457 test iterations

    The program should be able to be run on any TM4C129 series device with 256 Kbytes of SRAM and 1 Mbyte of flash. The PROGRESS_LED_PERIPHERAL, PROGRESS_LED_PORT and PROGRESS_LED_PIN macros in the TM4C129_self_test.c need to changed to select which GPIO pin is toggled to indicate the test is still running.

    Suggest you leave this test program running on your custom hardware. If the test program fails it suggests you have a hardware problem. If the test program doesn't fails it suggests you have a software problem.

    The CCS project is attached. TM4C129_selftest.zip

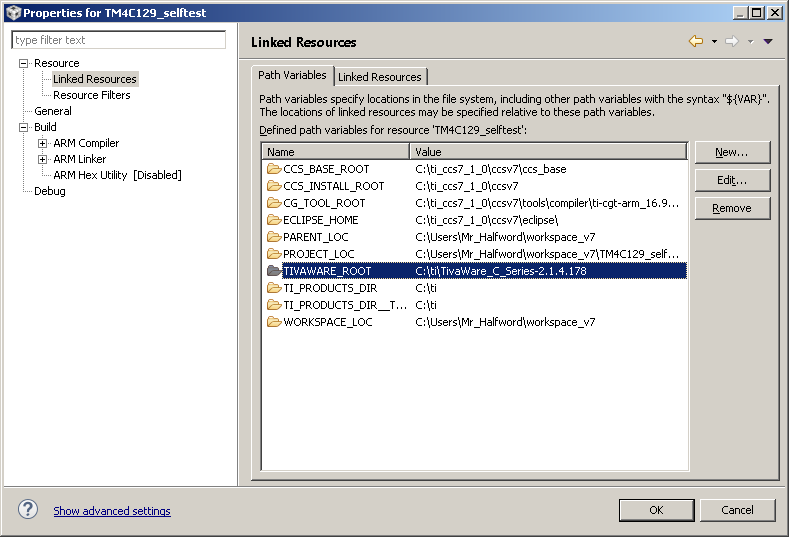
    The project contains Debug and Release configurations. Suggest the Release configuration is used since that executes tests at a faster rate. The project is set to use TivaWare installed at C:\ti\TivaWare_C_Series-2.1.4.178. If you have TivaWare installed at a different location edit the TIVAWARE_ROOT Path Variable: