This thread has been locked.

If you have a related question, please click the "Ask a related question" button in the top right corner. The newly created question will be automatically linked to this question.

CCS/TMS320F28027: TMS320F28027

Part Number: TMS320F28027


Tool/software: Code Composer Studio

Dear All;

I am coding F28027. I am coding part by part and trying it on microcontroller. Sometimes, an error is occured, I fix it, but code composer does not fix the error. Red cross keeps staying on its location. While compiling, CCS asks me about error. I click on PROCEED. It loads.It is succesfull about loading program. However, error cross stays there.

How can I fix it?

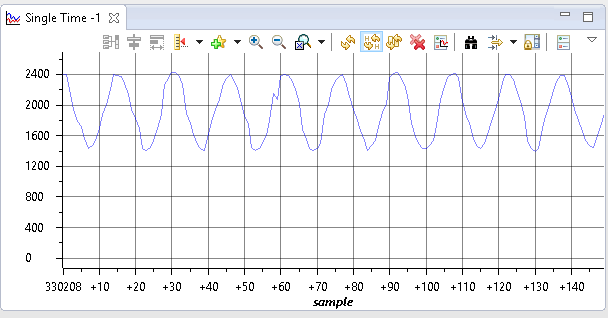
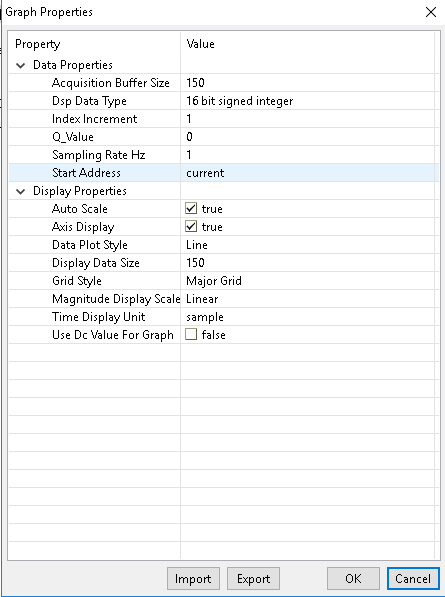
Second one is that, I am measuring AC current and using graph feature.Nevertheless, İllustrated data is not correct. It is unrelated graph but, when I pause the program, graphic shows me correct wave form. I have no idea how ı can fix it.

Please, I am waiting for your advice.

Regards

Fahri

  • Hi Fahri,

    user4594266 said:
    Sometimes, an error is occured, I fix it, but code composer does not fix the error. Red cross keeps staying on its location. While compiling, CCS asks me about error. I click on PROCEED. It loads.It is succesfull about loading program. However, error cross stays there.

    What is the exact error? A screenshot would be useful here

    user4594266 said:
    It is unrelated graph but, when I pause the program, graphic shows me correct wave form. I have no idea how ı can fix it.

    Is real-time mode enabled? If it is not, then the debugger would only refresh data on target halt (stop-mode debug)

    Thanks

    ki

  • Hi Ki

    I have solved the 'error problem'.

    However, drawing graph problem is still a problem.

    I have got some sceenshot to explain something more clear.

    I am sampling ac current signal the frequency of which is 21.3 KHz . Sampling frequency is 400KHz (with timer1). I am using an array which has 150 element to store current values and plot them in graph.

    Before I said, there is something wrong while plotting graph. Actually, in previous experiments, I could not see an ac current wave form. It was completely different. For the last experiment, I could observe sinusoidal wave form. Nevertheless, at this time, eventhrough the wave form was correct, number of waveform was not true. I mean ;

    400KHz/21.3KHz = 18.77....... sample for a period

    150/18.77= 7.98 period I should observe (150 length of current sampling array)

    Again, for the last experiment, I can see true wave form as sinus and number of period is true when I click on pause button for DSP. Screenshot is like that;

    But in continuous refresh mode, this time, wave form was correct. There was no wrong wave form. On the other hand, number of period was not correct. Like this;

    and graphic settings are adjusted as below;

    By the way; yes real time mode is enable. I have clicked on the continuous refresh button and I can observe that current wave form is shifting in windows. In addition, may be it can help you, program is running on flash mode but, timer interrupt which is used to measure current is time critical code, I mean, it is running from ram.

    I hope I could make it more clear.

    Thank you for your help.

    Regards

    Fahri