This thread has been locked.

If you have a related question, please click the "Ask a related question" button in the top right corner. The newly created question will be automatically linked to this question.

CCS/CCSTUDIO: Target must be connected before loading with TM4C123GH6PM

Part Number: CCSTUDIO
Other Parts Discussed in Thread: TM4C123GH6PM

Tool/software: Code Composer Studio

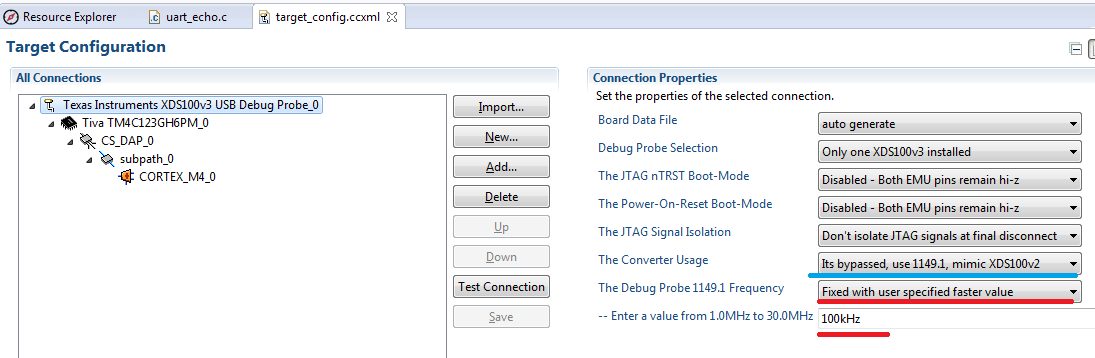
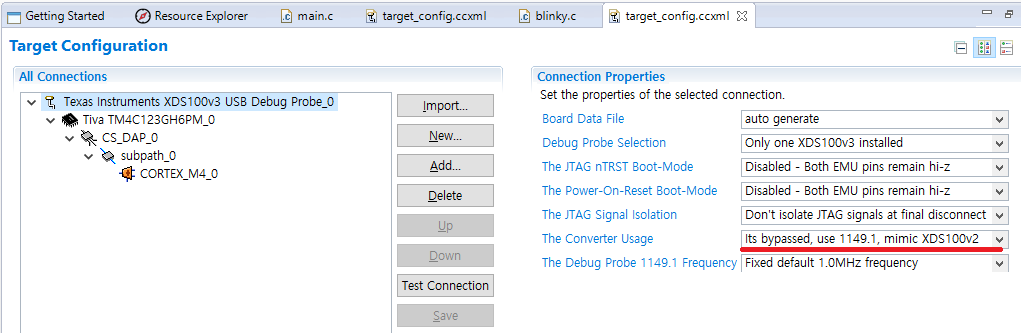
Hi, I created a custom perf board that uses TM4C123GH6PM, CCS 7.1, and XDS100v3 for 4 pins JTAG.

The following error appeared. I tried this Wiki's suggestion.

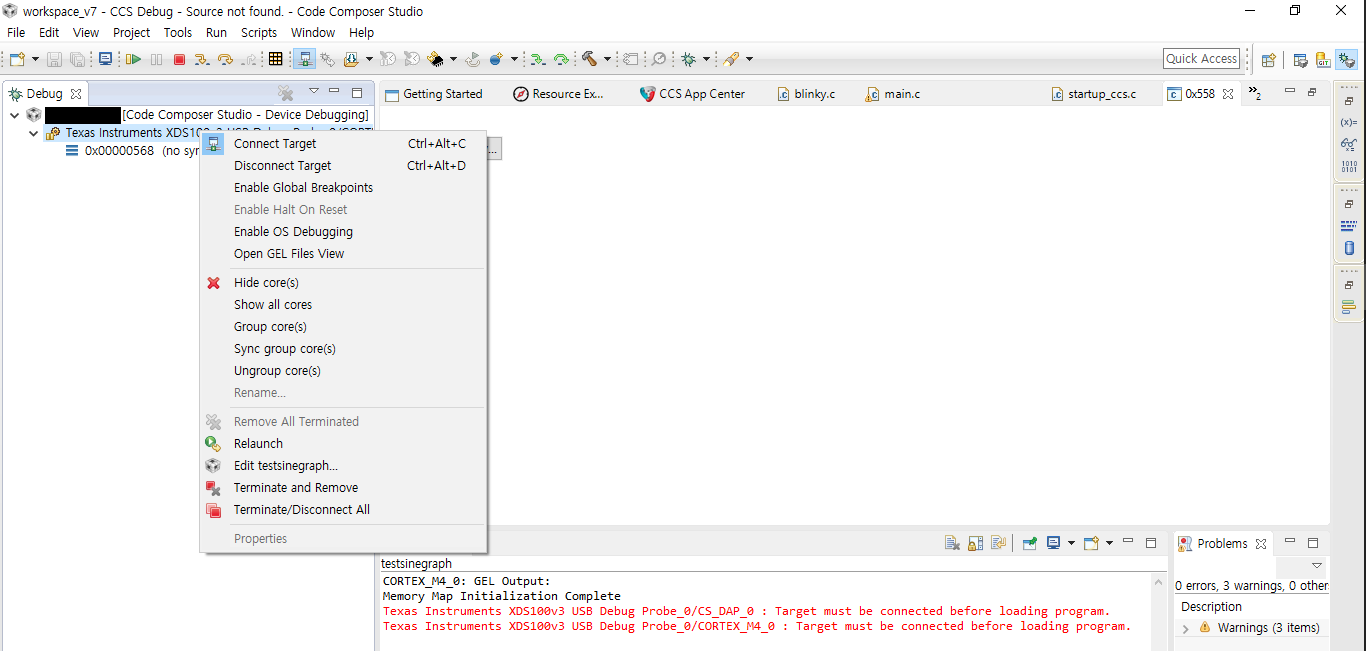
Although I clicked "Connect Target", nothing happened. I think it continuously runs an infinite loop.

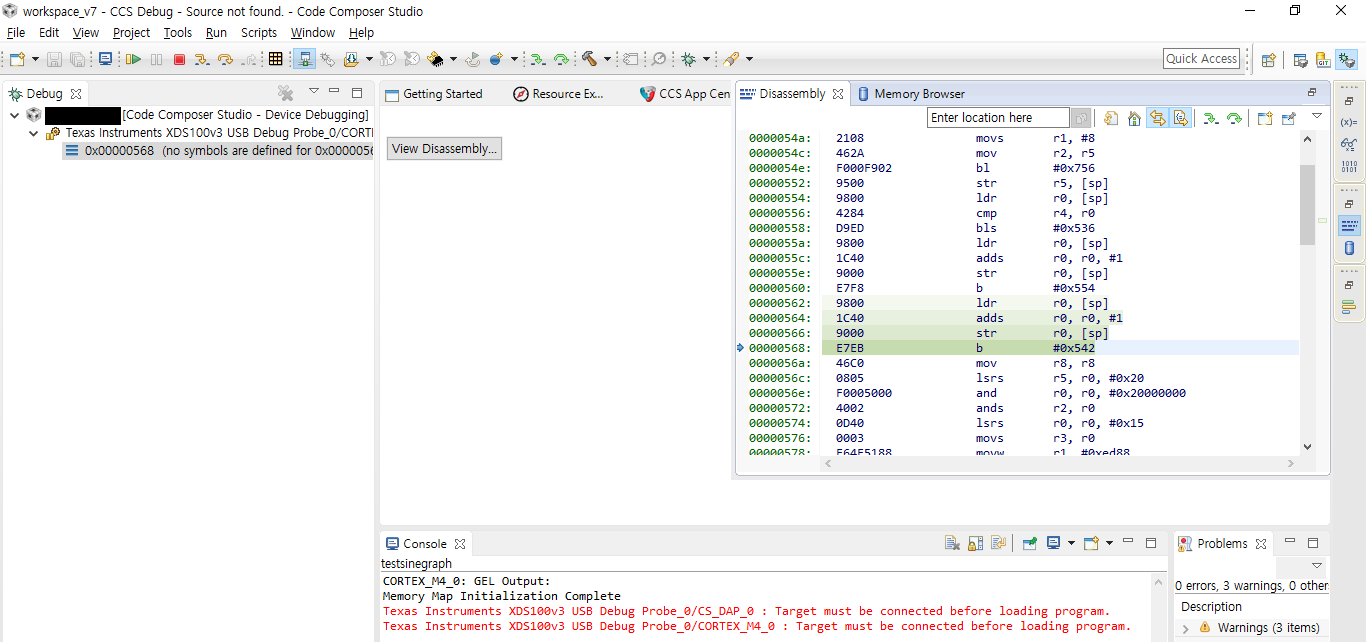
At least, I think the debugger is connected to the TM4C MCU since it runs some assembly codes.

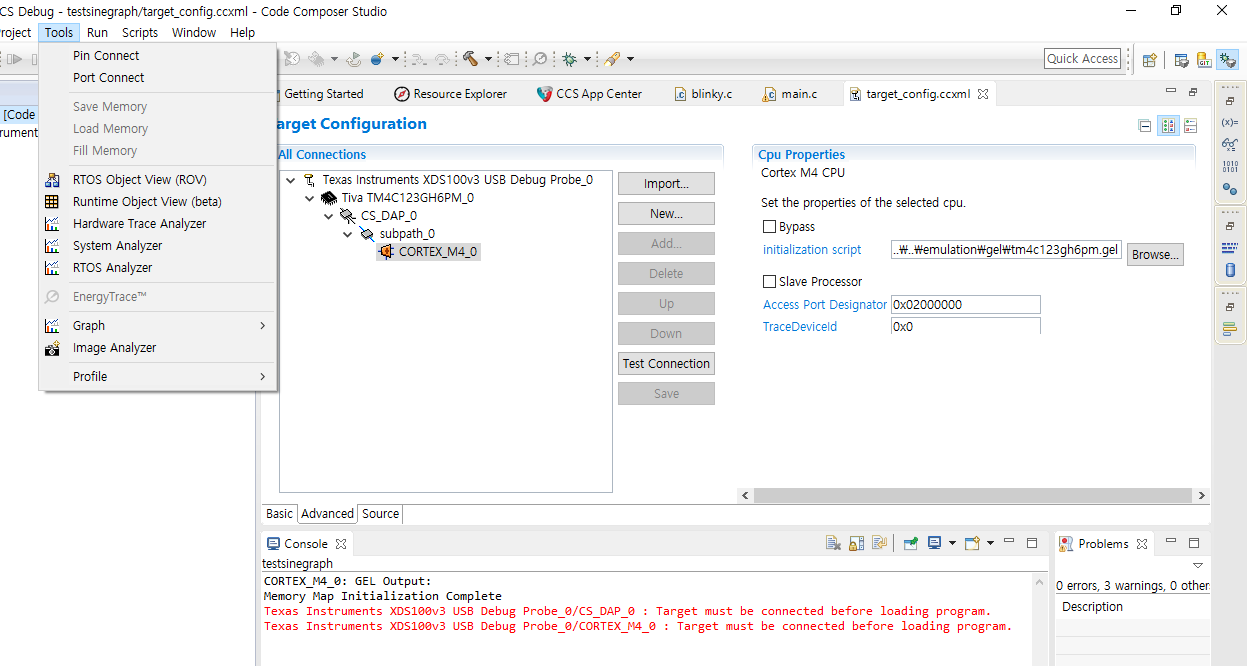
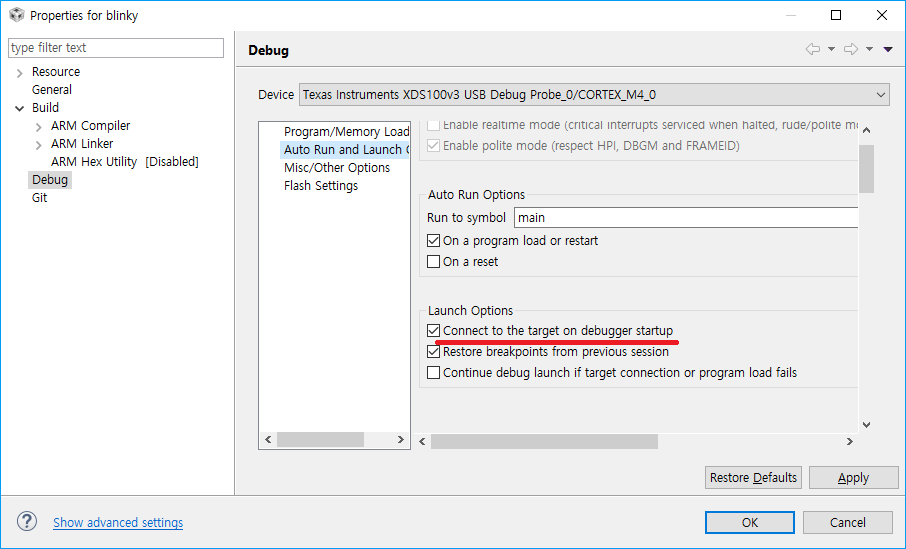
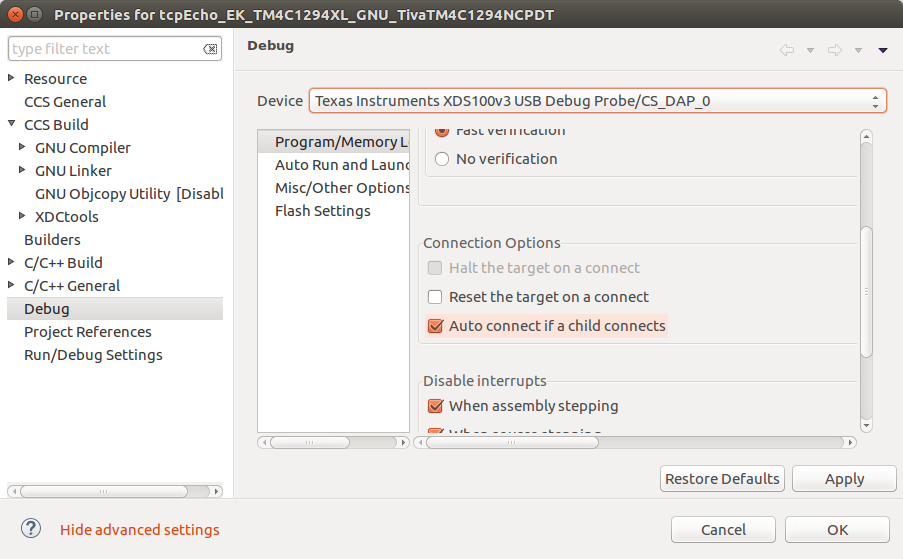
"In the CCS Debug perspective: "Tools -> Debugger Options -> Generic Debugger" and slect "Connect to Target on Debugger Setup"."

That alternative cannot be selected, either. In this case, what should I do to connect the target?

  • How are you starting up the debug session? Are you selecting the project in the Project Explorer view and clicking the "Debug"button. If so, the usual default behavior when doing this is to connect to target and load the program. If you are instead launching a target configuration file from the Target Configurations view, then the connection has to be done manually. More details about automatic and manual launch are in this page.

    If it is not connecting to the target in either way, then there is probably some other underlying hardware issue. Does the Test Connection come back ok?

  • Hello, AartiG.

    AartiG said:
    Are you selecting the project in the Project Explorer view and clicking the "Debug"button.

    Yes, I'm using that way.

    AartiG said:
    Does the Test Connection come back ok?

    Whoa. I didn't expect this result.

    [Start: Texas Instruments XDS100v3 USB Debug Probe_0]
    
    Execute the command:
    
    %ccs_base%/common/uscif/dbgjtag -f %boarddatafile% -rv -o -F inform,logfile=yes -S pathlength -S integrity
    
    [Result]
    
    
    -----[Print the board config pathname(s)]------------------------------------
    
    C:\Users\ElliotS\AppData\Local\TEXASI~1\
        CCS\ti\0\0\BrdDat\testBoard.dat
    
    -----[Print the reset-command software log-file]-----------------------------
    
    This utility has selected a 100- or 510-class product.
    This utility will load the adapter 'jioserdesusbv3.dll'.
    
    An error occurred while soft opening the controller.
    
    -----[An error has occurred and this utility has aborted]--------------------
    
    This error is generated by TI's USCIF driver or utilities.
    
    The value is '-151' (0xffffff69).
    The title is 'SC_ERR_FTDI_OPEN'.
    
    The explanation is:
    One of the FTDI driver functions used during the connect
    returned bad status or an error. The cause may be one or
    more of: no XDS100 is plugged in, invalid XDS100 serial number,
    blank XDS100 EEPROM, missing FTDI drivers, faulty USB cable.
    Use the xds100serial command-line utility in the 'common/uscif'
    folder to verify the XDS100 can be located.
    
    [End: Texas Instruments XDS100v3 USB Debug Probe_0]

    This is strange. I'm using a 64-bit Windows 10 machine. I selected the XDS100 drivers while installing CCS 7 on this machine.

    As a result, "C:\ti\ccsv7\ccs_base\emulation\windows\xds100_drivers" has the proper files (amd64 folder which has DLL files, xds100bus, xds100port and more).

    Also, the "jioserdesusbv3.dll" is located at the "C:\ti\ccsv7\ccs_base\common\uscif" directory.

    This is the screenshot when looking at the "Device Manager".

    Although there wasn't the "XDS100v3" item in the USB section, it is found at another section called "Texas Instruments Debug Probes".

    I think the device driver and my JTAG connection, which uses pull-up and pull-down resistors, are correct.

    By the way, the version of my XDS100v3 is "XDS100v3 Revision B".

    Currently, jumper J4 and J5 are opened. I followed this instruction.

    They are responsible for the emulation – adapter configuration.
    When J4 and J5 are open – the chosen mode is emulator mode. When J4 an J5 are closed the chosen mode is adapter.
    For general use of the XDS100v3 as emulator and debugger, please, keep jumpers J4 and J5 open.

    Then is this a problem with CCS 7? Is re-installing CCS the only way to solve this?

  • Hello David

    Was this the first time you have loaded the code on the custom board with XDS100v3?
  • Hi, Amit. Yes, it is the first time.

    Is there additional information you need?
  • Hello David,

    Please share the JTAG schematics of your board. My concern is that there may be a pin(s) mismatch between the JTAG from the XDS100v3 and the header on the board.

    Secondly, in your original post it is mentioned "4-pin JTAG". What is 4-pin JTAG?
  • Hello, Amit. Here's the schematic of my custom perf board.

    Q1: 32.768kHz XTAL AB26TRB-32.768KHZ-T (±20ppm Crystal 12.5pF 50 kOhm)

    Q2: 16MHz TXC CORPORATION 9B-16.000MEEJ-B (±10ppm Crystal 18pF 30 Ohm)

    IC1: 3.3V regulator LT1085CT-3.3#PBF , the 9V battery is the input

    Amit Ashara said:
    n your original post it is mentioned "4-pin JTAG". What is 4-pin JTAG?

    I wanted to express that I'm not using the ARM SWD to connect the MCU to the XDS100v3 and I use all 4 pins (TCK, TMS, TDI, and TDO).

    I also referred the "Sample Schematic for Compact TI 20-Pin Header" from here.

    Can you take a look at the wire connection, please?

    Is the "VBAT", "WAKE", or "HIB" pins configured correctly?

  • David__ said:
    AartiG
    Are you selecting the project in the Project Explorer view and clicking the "Debug"button.

    Yes, I'm using that way.

    Can you check the Project Properties under Debug -> Auto Run and Launch -> Launch Options to see if the "Connect to the target on debugger startup" option is ticked:

    If the "Connect to the target on debugger startup" option isn't ticked it will cause the Target must be connected before loading" error when starting a debug session.

    Given your test connection is failing not sure if the "Connect to the target on debugger startup" option not being ticked is the cause of errors when starting a debug session, but worth checking.

  • Hello David,

    The TDIS pin must be connected to GND. It is left NC in the schematic.

    Also when you connect the XDS100v3 probe, what does the PC device manager show?
  • Hi, Chester. Thanks for pointing that out. I was testing with the "blinky" example.

    Surprisingly, that wasn't checked. I have checked it now.

    Previously, there were 2 error messages.

    Now, only one message appears. Funny thing is that the code can be debugged!

    I have run the single line of codes and observed the LED blinking.

  • Thank you, Amit.

    Amit Ashara said:
    The TDIS pin must be connected to GND. It is left NC in the schematic.

    Thanks for noticing this. I have connected it now. After connecting the TDIS pin, this is the result of the "test connection".

    [Start: Texas Instruments XDS100v3 USB Debug Probe_0]
    
    Execute the command:
    
    %ccs_base%/common/uscif/dbgjtag -f %boarddatafile% -rv -o -F inform,logfile=yes -S pathlength -S integrity
    
    [Result]
    
    
    -----[Print the board config pathname(s)]------------------------------------
    
    C:\Users\ElliotS\AppData\Local\TEXASI~1\
        CCS\ti\0\0\BrdDat\testBoard.dat
    
    -----[Print the reset-command software log-file]-----------------------------
    
    This utility has selected a 100- or 510-class product.
    This utility will load the adapter 'jioserdesusbv3.dll'.
    The library build date was 'May  2 2017'.
    The library build time was '12:59:57'.
    The library package version is '6.0.628.1'.
    The library component version is '35.35.0.0'.
    The controller does not use a programmable FPGA.
    The controller has a version number of '4' (0x00000004).
    The controller has an insertion length of '0' (0x00000000).
    This utility will attempt to reset the controller.
    This utility has successfully reset the controller.
    
    -----[Print the reset-command hardware log-file]-----------------------------
    
    The scan-path will be reset by toggling the JTAG TRST signal.
    The controller is the FTDI FT2232 with USB interface.
    The link from controller to target is direct (without cable).
    The software is configured for FTDI FT2232 features.
    The controller cannot monitor the value on the EMU[0] pin.
    The controller cannot monitor the value on the EMU[1] pin.
    The controller cannot control the timing on output pins.
    The controller cannot control the timing on input pins.
    The scan-path link-delay has been set to exactly '0' (0x0000).
    
    -----[The log-file for the JTAG TCLK output generated from the PLL]----------
    
      Test  Size   Coord      MHz    Flag  Result       Description
      ~~~~  ~~~~  ~~~~~~~  ~~~~~~~~  ~~~~  ~~~~~~~~~~~  ~~~~~~~~~~~~~~~~~~~
        1     64  - 01 00  500.0kHz   O    good value   measure path length
        2     64  + 00 00  1.000MHz  [O]   good value   apply explicit tclk
    
    There is no hardware for measuring the JTAG TCLK frequency.
    
    In the scan-path tests:
    The test length was 2048 bits.
    The JTAG IR length was 4 bits.
    The JTAG DR length was 1 bits.
    
    The IR/DR scan-path tests used 2 frequencies.
    The IR/DR scan-path tests used 500.0kHz as the initial frequency.
    The IR/DR scan-path tests used 1.000MHz as the highest frequency.
    The IR/DR scan-path tests used 1.000MHz as the final frequency.
    
    -----[Measure the source and frequency of the final JTAG TCLKR input]--------
    
    There is no hardware for measuring the JTAG TCLK frequency.
    
    -----[Perform the standard path-length test on the JTAG IR and DR]-----------
    
    This path-length test uses blocks of 64 32-bit words.
    
    The test for the JTAG IR instruction path-length succeeded.
    The JTAG IR instruction path-length is 4 bits.
    
    The test for the JTAG DR bypass path-length succeeded.
    The JTAG DR bypass path-length is 1 bits.
    
    -----[Perform the Integrity scan-test on the JTAG IR]------------------------
    
    This test will use blocks of 64 32-bit words.
    This test will be applied just once.
    
    Do a test using 0xFFFFFFFF.
    Scan tests: 1, skipped: 0, failed: 0
    Do a test using 0x00000000.
    Scan tests: 2, skipped: 0, failed: 0
    Do a test using 0xFE03E0E2.
    Scan tests: 3, skipped: 0, failed: 0
    Do a test using 0x01FC1F1D.
    Scan tests: 4, skipped: 0, failed: 0
    Do a test using 0x5533CCAA.
    Scan tests: 5, skipped: 0, failed: 0
    Do a test using 0xAACC3355.
    Scan tests: 6, skipped: 0, failed: 0
    All of the values were scanned correctly.
    
    The JTAG IR Integrity scan-test has succeeded.
    
    -----[Perform the Integrity scan-test on the JTAG DR]------------------------
    
    This test will use blocks of 64 32-bit words.
    This test will be applied just once.
    
    Do a test using 0xFFFFFFFF.
    Scan tests: 1, skipped: 0, failed: 0
    Do a test using 0x00000000.
    Scan tests: 2, skipped: 0, failed: 0
    Do a test using 0xFE03E0E2.
    Scan tests: 3, skipped: 0, failed: 0
    Do a test using 0x01FC1F1D.
    Scan tests: 4, skipped: 0, failed: 0
    Do a test using 0x5533CCAA.
    Scan tests: 5, skipped: 0, failed: 0
    Do a test using 0xAACC3355.
    Scan tests: 6, skipped: 0, failed: 0
    All of the values were scanned correctly.
    
    The JTAG DR Integrity scan-test has succeeded.
    
    [End: Texas Instruments XDS100v3 USB Debug Probe_0]

    Well, I think it showed some good news to me. I'm using the blinky example.

    I have changed the debugging configuration.

    Previously, two error messages showed up when I pressed the "Debug" button.

    Whereas, only one error message pops up, now.

    Funny thing is that the code can be debugged! I have run the single line of codes and observed the LED blinking.

    Amit Ashara said:
    Also when you connect the XDS100v3 probe, what does the PC device manager show?

    I'm using a 64-bit Windows 10 machine.

    I cannot observe "XDS100v3" at the USB section.

    However, there was a section called "TI debug probes" and I can find the XDS100v3.

    Now, maybe one step is left to resolve that error message. Although the debugging is working, I want to solve that problem.

    Can you give me some help with this?

  • David__ said:
    Surprisingly, that wasn't checked. I have checked it now.

    There seems to be a quirk in CCS 7.1 that when a new target configuration is created for a XDS100v3 and a Tiva device the "Connect to the target on debugger startup" isn't checked by default for the CORTEX_M4_0 device.

    Whereas it is ticked by default when a new target configuration is created when a Stellaris In-Circuit Debug Interface is used.

    David__ said:
    Now, only one message appears. Funny thing is that the code can be debugged!

    The remaining error is about connecting to the CS_DAP_0 device. If you check the debug project properties and select "CS_DAP_0" as the device is the "Auto connect if a child connects" option ticked?

    [I don't have a XDS100v3 so can't check the effect of the options for the CS_DAP_0 device]

  • Hello David,

    So basic connection is established. Unfortunately I do not have an XDS100v3 handy with me. Can you just send in the ccxml Target Configuration file for inspection?
  • Chester Gillon said:
    If you check the debug project properties and select "CS_DAP_0" as the device is the "Auto connect if a child connects" option ticked?

    Nope. So I selected "CS_DAP_0" and clicked "OK".

    However, as you see this video, that menu returns back to "CORTEX_M4_0". Quite surprising.

    The version of my CCS is " Version: 7.1.0.00016 ".

    Well, the good news is that the debugging is working. So I just hope the TI team will check this "bug" in the near future.

    I deeply appreciate your time for helping me. Have a nice day!

  • Amit Ashara said:
    Can you just send in the ccxml Target Configuration file for inspection?

    Hello, here you go.

    target_config.zip

    Also, can you check the video which I've posted on the previous thread, please?

    I think that can give some information as well.

  • Hello David.

    Can you change the parameter "The Debug Probe 1149.1 Frequency" from "Fixed default 1.0MHz" to "Fixed with user specified slower va;ue" and enter the value as 100KHz and then try to connect the device?
  • Hello, Amit.

    Like this?

    One weird thing is observed; compared to the "blinky" example when I import the "timers" example

    and change the configuration to use the XDS100v3 (but not setting the frequency to 100kHz), the error doesn't pop up

    even though it is configured to the "CORTEX_M4_0". I used a Windows 7 machine this time.

    Anyways, is that the configuration you've recommended? Or should I change the "Converter Usage" to "Generate 1149.7 4-pin standard mode"?

  • Hello David

    So does the board work as expected?
  • Hello, Amit. Only the "timers" example works as expected.

    When working with the "blinky" example, it does not work as expected.

    Then can we conclude that this is a bug created by CCS 7?