This thread has been locked.

If you have a related question, please click the "Ask a related question" button in the top right corner. The newly created question will be automatically linked to this question.

CCS/OMAP-L137: How to emulate code, distributed over multiple projects

Part Number: OMAP-L137


Tool/software: Code Composer Studio

Hi,

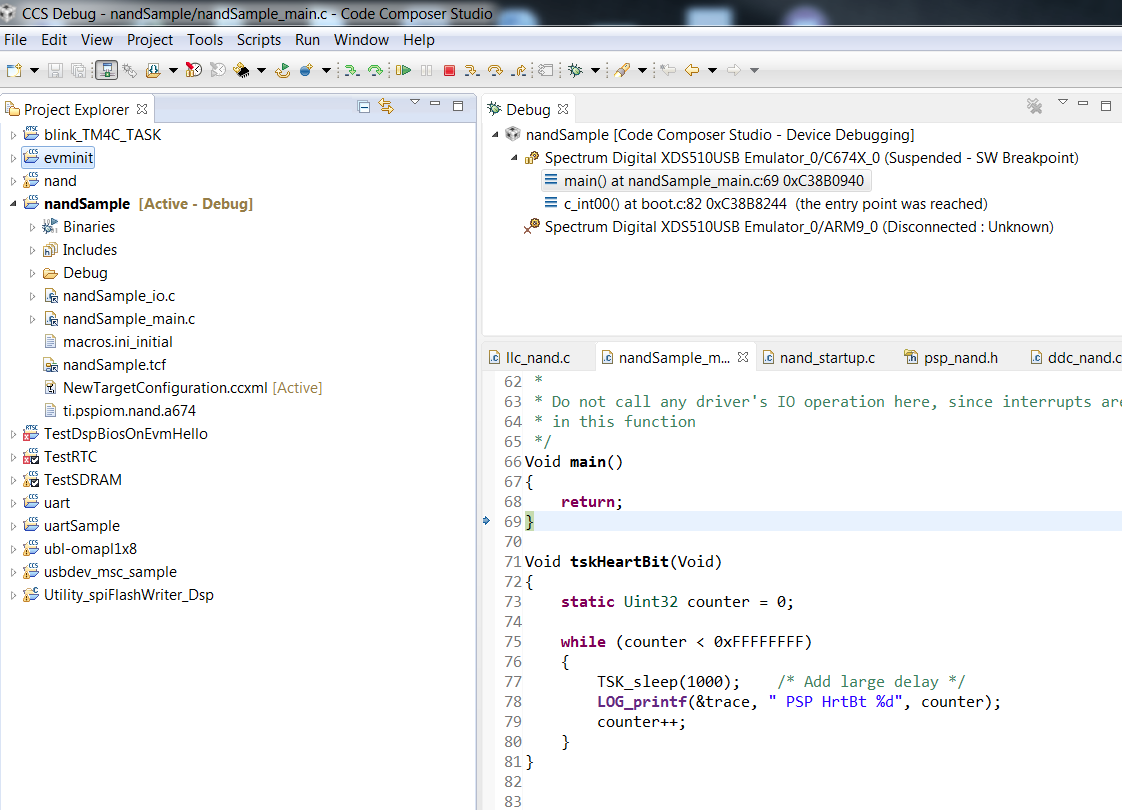
I had a question on code debugging. I am trying to run the 'nandSample' project from the PSP_01_03 (DSPBIOS 05_42) on my EVM board (OMAPL137). My NAND is different so I wanted to change few parameters in ‘nand_startup.c’. My question is, once I make my changes to a project like ‘evminit’, how do I emulate it on the target?

I can emulate ‘nandSample’ project. The moment code execution steps out of 'nandSample', debugger cannot correlate to the code residing in other project folders. 

 Would appreciate some help here. 

Thanks, 

AQ


  • AQ,

    If I understood your problem correctly, you have a code residing on Flash and, after the boot sequence finishes copying it to RAM you lose debug information, is that so?

    In this case, you can always add symbols to your running debug session by simply going to menu Run --> Load --> Load Symbols (or Add Symbols if you already have other code loaded). You can also apply the code and data offsets to properly place the symbols in memory.

    Hope this helps,
    Rafael
  • Hi Rafael,

    Thanks for a quick reply.

    No i am not running code through Flash. I am using a debugger. I think a picture should clear the confusion here.

    So now maybe my earlier post would make more sense. The project 'evminit' compiles to a library file. So i cannot load the symbols through the *.out file, as you suggested. 

    Thanks, 

    AQ

  • AQ,

    There should be some code in your nandSample project that calls one or more functions from the evminit library. This would then cause the compiler/linker to pull in the functions that you modified in the evminit project. The nandSample_main.c that is I see has another function, echo(), after the tskHeartBit task. Do you have more code that does that?

    Regards,
    RandyP
  • Hi Randy, 

    Thanks for the reply. 

    Yes code in echo would call a function 'configureNand()' which resides in the project 'evminit'. But when I single step (F5) into 'configureNand()' the debugger loses sight of the code. 

    There should be a way to tell the debugger where to look for that piece of code so that it can correlate the actually written code with the executed assembly instruction. I am not aware of that way :)

    Let me know if someone can help here. 

    Thanks, 

    AQ

  • AQ,

    There is likely a way to do the source-code debug of a library function, but I do not know it. Perhaps Rafael will be able to explain this or point you to the documentation (C Compiler manual, for example) or find someone who can help with this.

    The two easy options that I can think of are

    1. Use the assembly step-into at the call to configureNand() and debug in the Disassembly window. You might need to open that window first.

    2. Find the source code file that has configureNand() in it and pull a copy into your nandSample project. The linker will pull in the local object file before pulling from the evminit library file. In some cases, you might need to pull in a copy of all of the evminit source code and build it all within nandSample.

    Regards,
    RandyP
  • AQ,

    RandyP said:
    There is likely a way to do the source-code debug of a library function, but I do not know it.

    If your library was built with debug symbols, you can follow the details in section 6 of the following wiki:

    http://processors.wiki.ti.com/index.php/Debug_Handbook_for_CCS  

    For added practicality you can also use the Modules view - check this short clip for details.

    Hope this helps,

    Rafael