This thread has been locked.

If you have a related question, please click the "Ask a related question" button in the top right corner. The newly created question will be automatically linked to this question.

CCS/MSP430G2553: Value Line Gxxx and CCS 7.2

Part Number: MSP430G2553
Other Parts Discussed in Thread: MSP430G2955,

Tool/software: Code Composer Studio

Hi, I'm having some problems to flash and debug many projects in MSP430 value line.

If I try to flash a simple blink everything works well, but for more complex programs (in special with float variable). The flashing process takes longer than normal and when it finish it's impossible debug something because the process is very slow.

The same problem occur in the launchpad value line with MSP430G2553 and with a MSP430G2955 using a FET430UIF.

  • Hello,

    Haroldo Amaral said:
    The flashing process takes longer than normal and when it finish it's impossible debug something because the process is very slow.

    How slow? Several minutes? Is it just the flashing or is the whole debug experience slow>

    Thanks

    ki

  • Ki-Soo Lee said:

    How slow? Several minutes? Is it just the flashing or is the whole debug experience slow>

    For both process. Using the launchpad I had to stop the flashing because it never ended.

    I tested a simple code generating a sine wave in an array of 64 points. I started the debug and 10 minutes after I stopped the session without reach the breakpoint after the loop.

    It appear to be a problem with the value line in this CCS version, because the same code works without problem in the series Fxxx (F5529, F6736) and FRxxx (FR6989, FR5994).

  • Haroldo Amaral said:
    Using the launchpad I had to stop the flashing because it never ended.

    can you show me a screenshot of CCS at this state?

    Haroldo Amaral said:
    I started the debug and 10 minutes after I stopped the session without reach the breakpoint after the loop.

    I suspect an issue with the application when it is unable to reach main (and any point afterwards). CCS, by default, should auto-run to main after program load. If it cannot reach main, it will just run continuously (often stuck somewhere).

    ki

  • Hi Ki,

    Ki-Soo Lee said:

    can you show me a screenshot of CCS at this state?

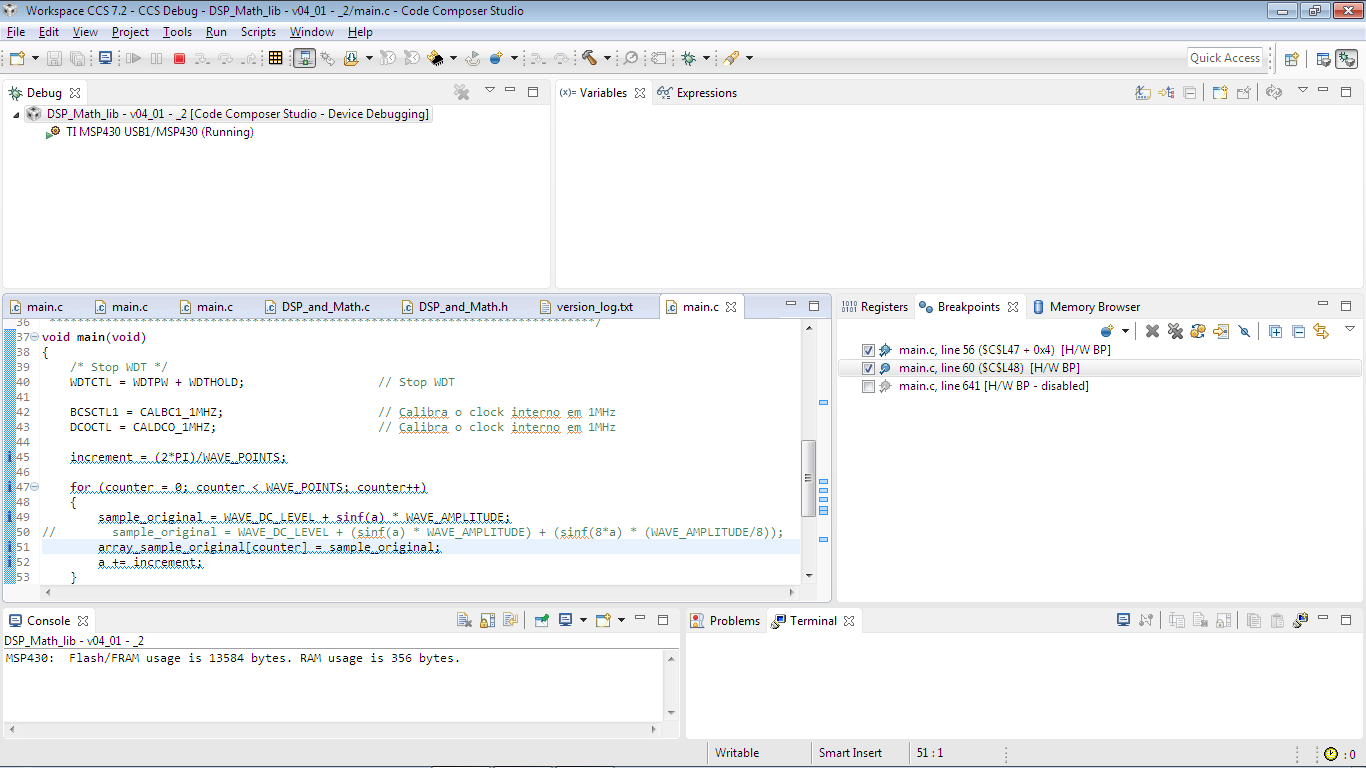
    below there is the print of CSS using MSP430G2553. After the "loading process" ended, it stop on this screen a long time. I kept waiting, and after 5 or more minutes the session was "OK". But after press "Run" the problem persisted.

    Ki-Soo Lee said:

    I suspect an issue with the application when it is unable to reach main (and any point afterwards). CCS, by default, should auto-run to main after program load. If it cannot reach main, it will just run continuously (often stuck somewhere).

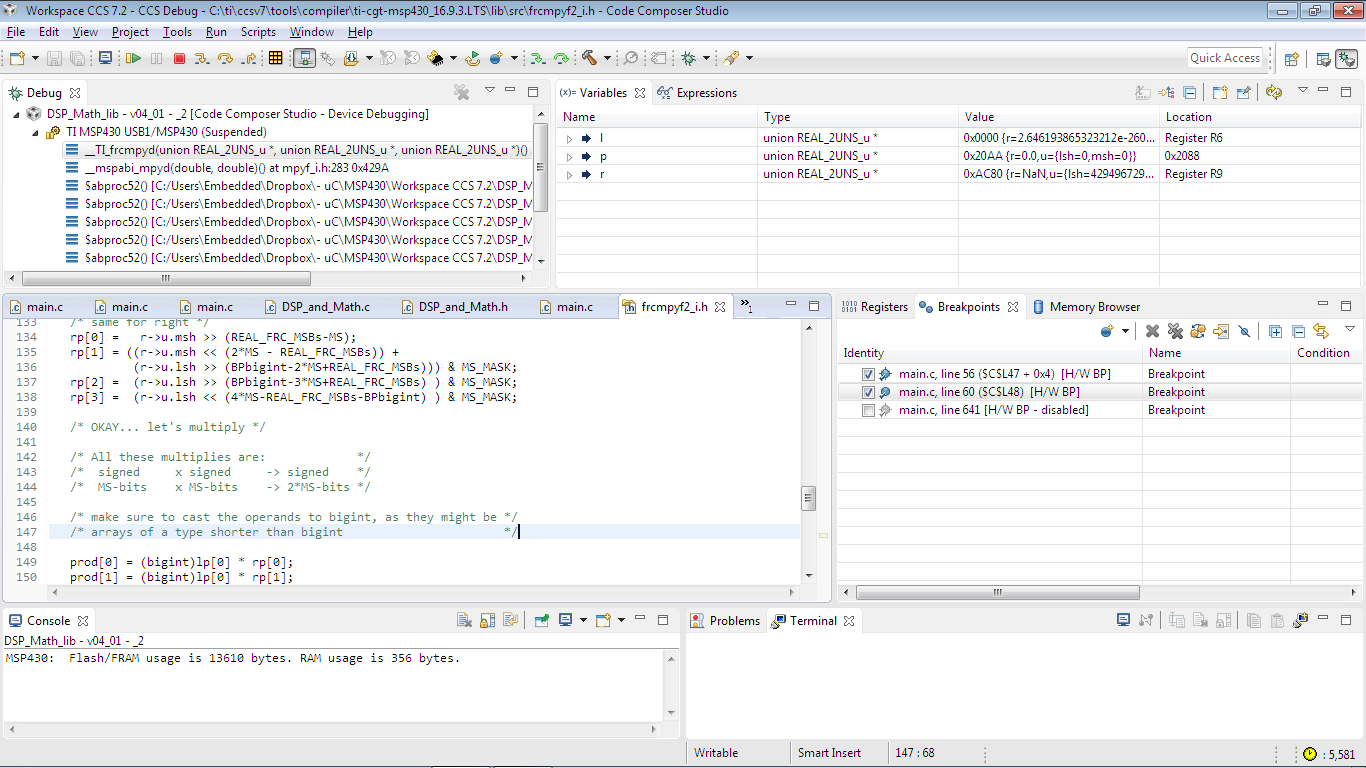
    I think no, because running step by step the program enter in the main loop and reach the for loop, but after I press "Run" a long time pass without reach the breakpoint (after the loop). When I press "Pause" the code stopped inside some functions related to implementation of float point.

    I attached the project below

    DSP_Math_lib - v04_01 - _2.rar

  • Thank you for the project. I was able to import and debug the project. The debug speed seems reasonable. I was able to start the debugger, flash the program, run to main and then a breakpoint set at line 56 in less than one minute for sure.

    I am using CCSv7.2.0 with an MSP430G2553 LaunchPad on a Windows 7-64 machine.

    I am not sure why in your environment, it is running so slow. Are you using the G2253 launchPad or is this a custom board?

    Can you try the steps to clean your environment?
    processors.wiki.ti.com/.../Troubleshooting_CCSv7

    Thanks
    ki
  • I think I found the source of problem. In your test the the "clock profile" was disabled, correct?

    I tried to create a new workspace but after the first reset in the debug the problem persisted. Then I tried to disable the "clock profle" (normally I use it to verify the efficiency of some codes) and the code worked fine.

    Try to reproduce it. I think that there is a problem with clock profile in value line. In the past I encountered other issue related to clock, specifically in the version 5.5, when the showed value was aleatory (e2e.ti.com/.../1023753)

  • Yes, sounds like the same issue described by Walter in that thread. Enabling the profile clock slows execution time dramatically for me too. I guess it is a limitation with the hardware (based on Walter's comments). Good catch.

    ki
  • Actually, when carefully rereading Walter's post, he seems to refer to the overhead spent to read the clock. The clock should only be read when the target is halted. There seems to be some other slowdown here (as Walter alluded to near the end of his post)
  • Hello,
    I haven’t heard back from you, I’m assuming you were able to resolve your issue. If not, please provide post a reply with an update below (or create a new thread).

    thanks,
    ki
  • Hi Ki-Soo Lee,

    I think the last answer solves / shows the limitation related to clock measurement. Just more one question, the internal jtag hardware is so different between value line and other lines?
  • It can be different. The key thing would be the debug/analysis module on the device that determines things like the availability of a profile clock and other debugger capability like EnergyTrace. An example of this is the EEM:

    http://dev.ti.com/tirex/#/?link=Development%20Tools%2FIntegrated%20Development%20Environments%2FCode%20Composer%20Studio%2FDebug%2FTraining%2FEnhanced%20Emulation%20Module%20(EEM)

    As for all the supported debug capability between the different lines, I don't know. The folks in the MSP forums would know best.

    Thanks

    ki

  • Haroldo Amaral said:
    Just more one question, the internal jtag hardware is so different between value line and other lines?

    Table 1. Emulation Module Overview in Advanced Debugging Using the Enhanced Emulation Module (EEM) With Code Composer Studio Version 6 gives an overview of the EEM capabilities in different MSP430 device families.

    The value line parts don't have a hardware cycle counter. When the cycle counter is enabled in CCS for a MSP430 device without a hardware cycle counter the program is stepped one instruction at a time to measure the cycles which makes the program run slowly.