


Part Number: TMS320F28069M
Tool/software: Code Composer Studio
Hello,
I wanted to start using graph window in order to trace timing execution of my program. First, I've created a simple int32_t variable (Flag_datalogTest) that toggles its value from 0 to 1 every second. Then I tried to see those changes in a graph window, but it doesn't work...
Theoretically, the single-time plot is all I need - I would set a single-character acquisition buffer , supply an address of my variable and see it change anytime I refresh the window. And it works like that, but only if I pause the debugger - with the program running, it shows 0 all the time...
I've found an information that the display is simply too slow to catch changes with such a small buffer. So I've decided to use Datalog module, similarly as in Instaspin labs. I connected the 3rd channel to my variable, placed the DATALOG_update in an interrupt routine so that it updates every milisecond and set the DATA_LOG_BUFF_SIZE to 500. I run the code and got two problems:
1) The values reached at the plot are totally out-of-scale and quite randomly distributed
2) They don't change anyways (although the scale keeps moving)...
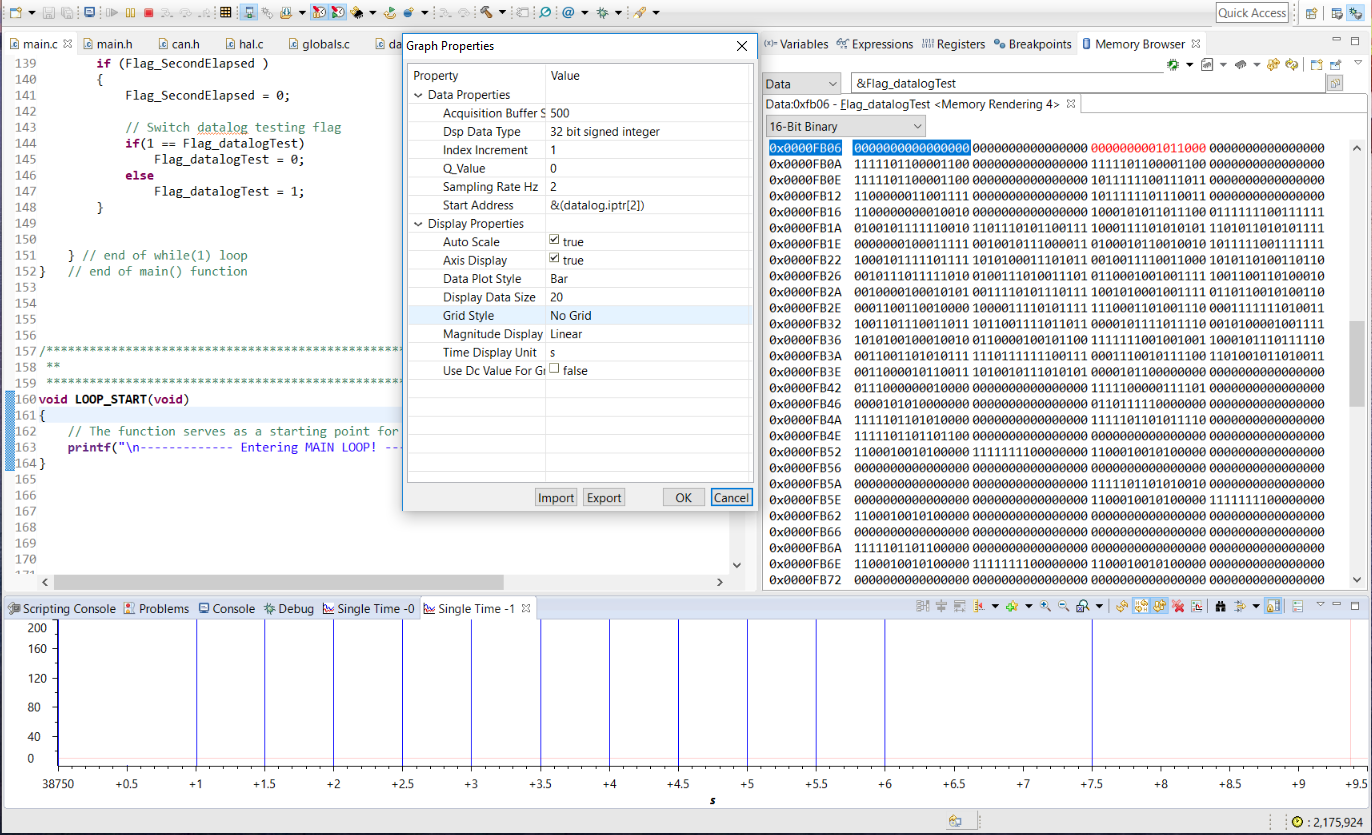
Here is a screenshot which shows:
- The portion of code toggling my flag every second (I can see it works good at the memory view)
- The graph window showing the result
- The graph properties that I set
Could someone please give me an advice on how to see proper values of 0 and 1 on the plot?
Do I understand correctly that: my Datalog module gathers 1 value per 1 milisecond => all 500 values are updated after every 500ms => 2Hz sampling frequency of the graph window is the one that fits just right?
