Tool/software: Code Composer Studio
HI
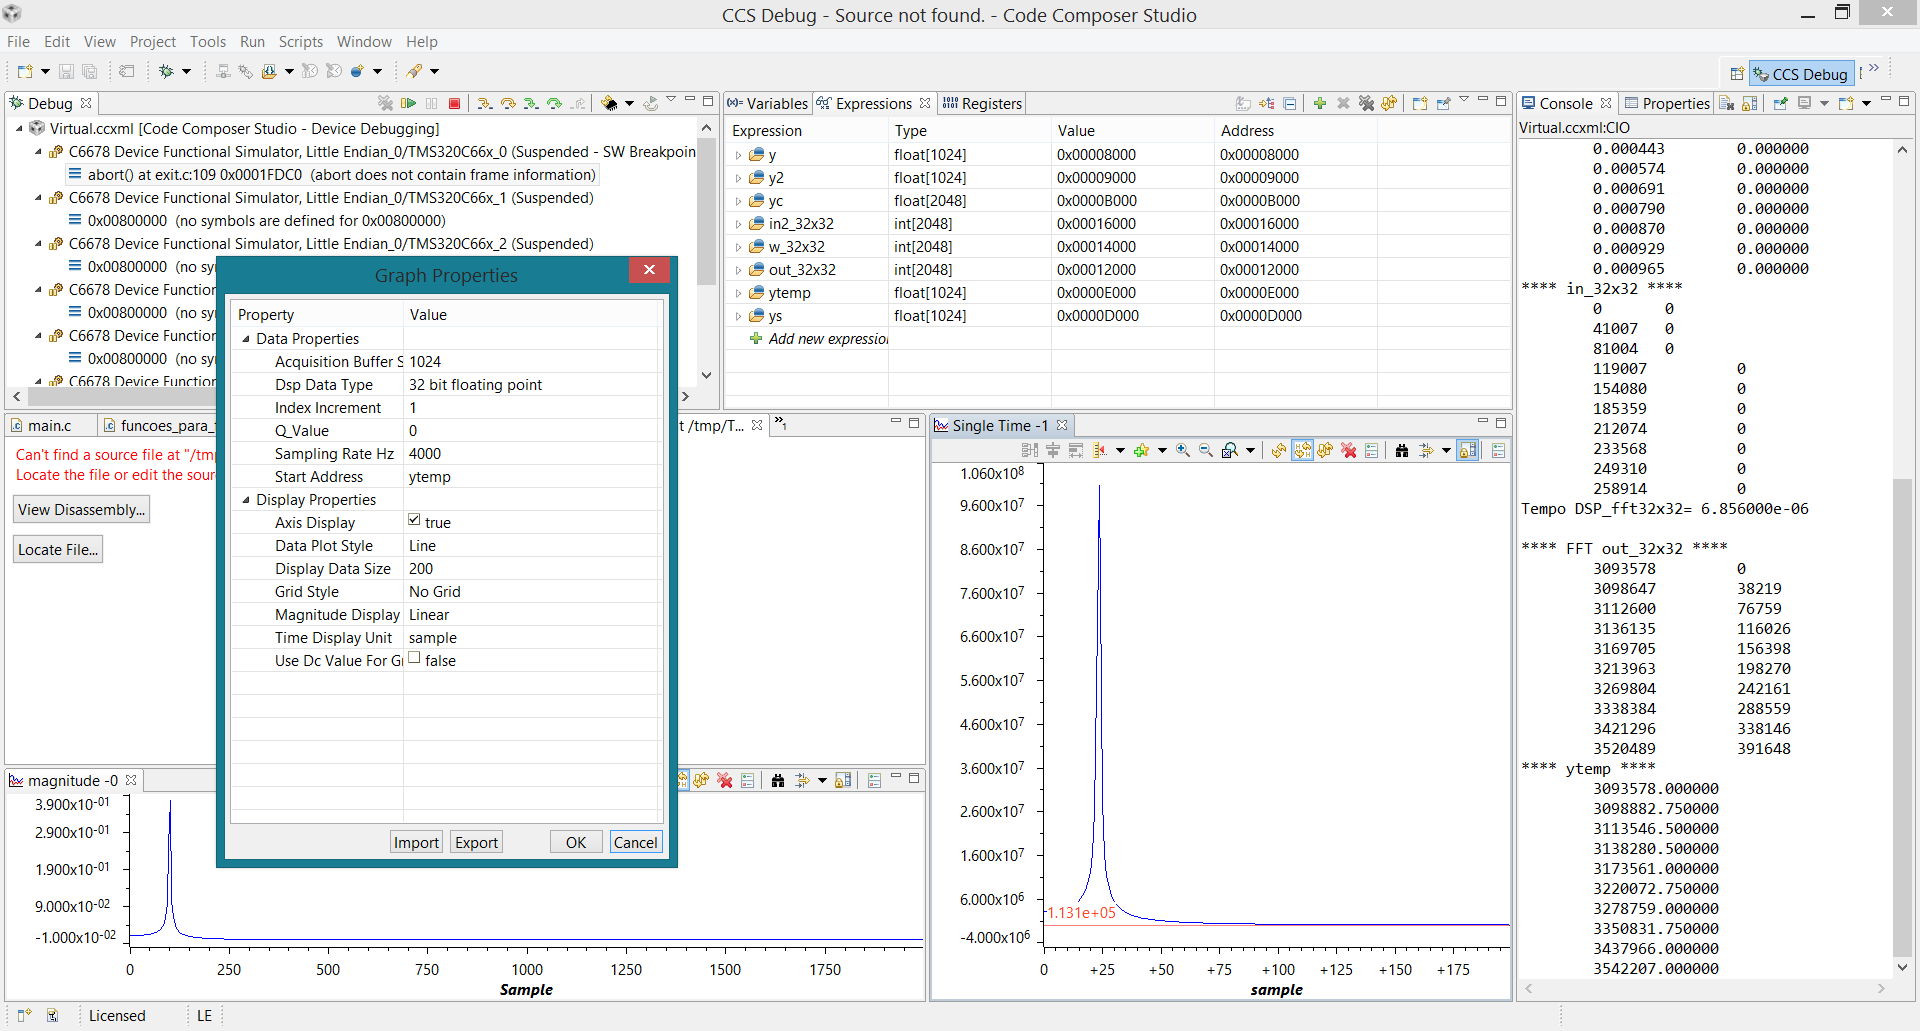
I am trying to plot fft from routine "DSP_fft32x32(w_32x32, NPT, in_32x32, out_32x32);" in fft_example
from dsplib_c66x_3_4_0_0 dir.
I have made my code to have data to sin wave
In figure above I have this results.
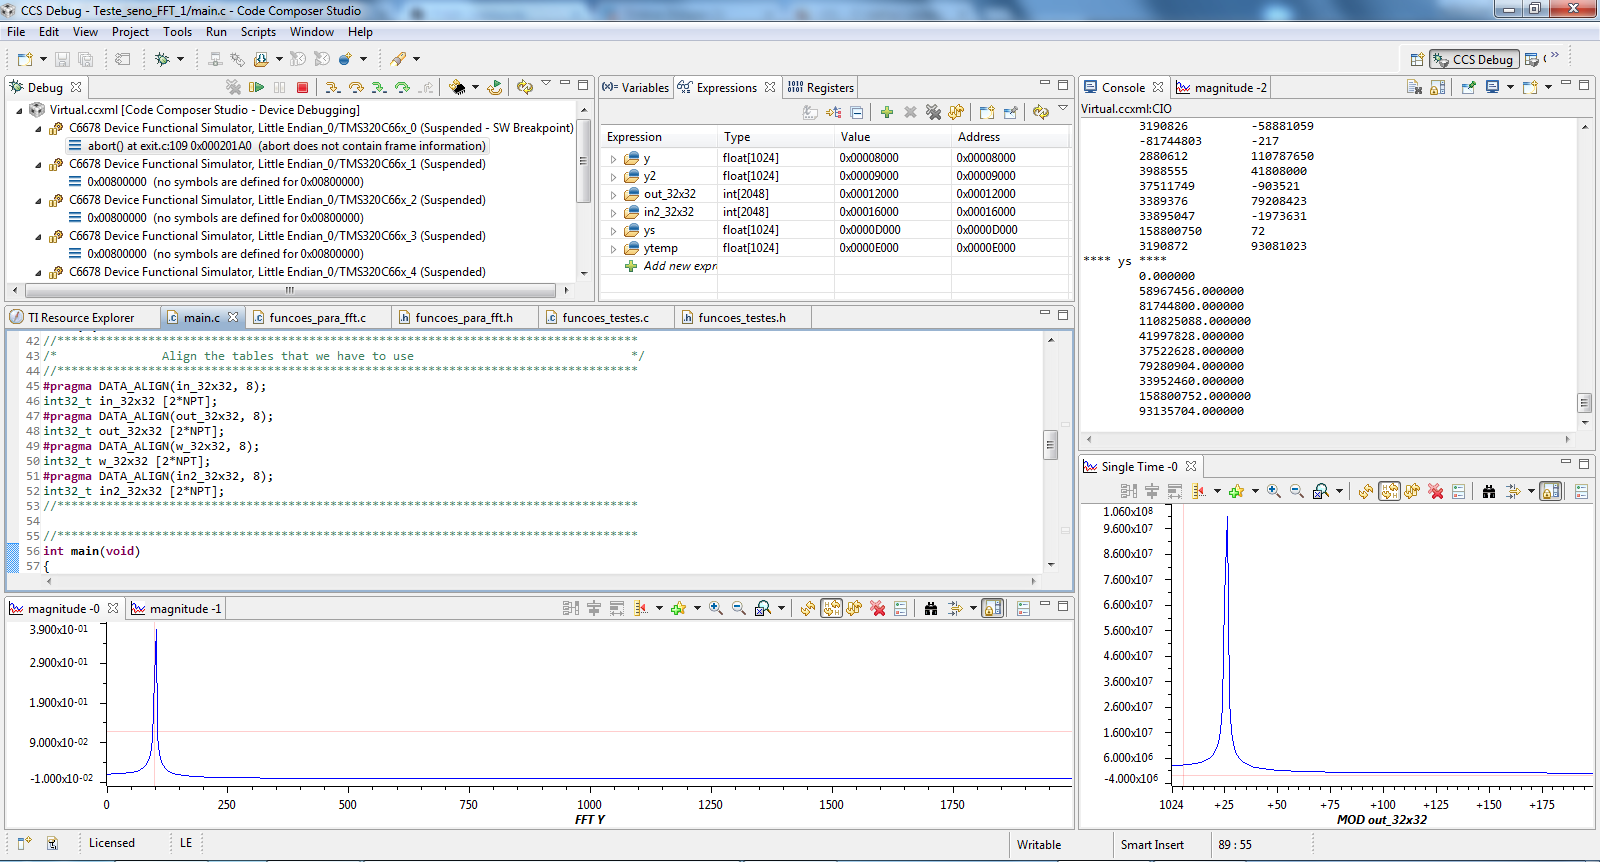
The magnitude plot shows the FFT from CCS tools. Now the single time the abs(Real + imag) from out_32x32.
My question is What kind of mistake i am doing? The Central freq should be 100Hz and is showing 25Hz