


Part Number: CODECOMPOSER
Tool/software: Code Composer Studio
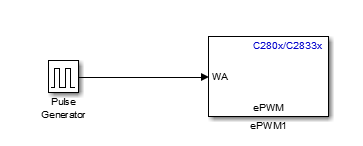
I am using a pulse generator in Simulink to create a pulse with a pulse width 50% and an amplitude of 100. The pulse is provided to the CMPA input of the ePWM1 block, as depicted in the next picture:
I have built the relevant model with Simulink and I loaded the model in a DSP (Texas Instrument C2000 Experimenter kit, F28335 Delfino Control Card) with Code Composer 6.0.0.
I want to see in a graph in Code Composer the values of the CMPA register, which should normally be the pulse from the aforementioned pulse generator. I set the following parameters in the graph properties:

However, for any sampling ratte that I choose in the graph properties, around 16 samples per second are always depicted in the graph. This is OK when trying to observe a pulse with a period of 1 or 2 seconds. However, when trying to visualize a pulse with a small period (e.g. 1e-04 seconds) the values are apparently not depicted correctly in the graph. Is there a way to adjust the samples per second that are depicted in the graph? Or alternatively is there another way to correctly depict pulses of small period?

