This thread has been locked.

If you have a related question, please click the "Ask a related question" button in the top right corner. The newly created question will be automatically linked to this question.

CCS/IWR1642: Capture Demo data memory capture mode over CCS

Part Number: IWR1642
Other Parts Discussed in Thread: SYSBIOS,

Tool/software: Code Composer Studio

Good morning,

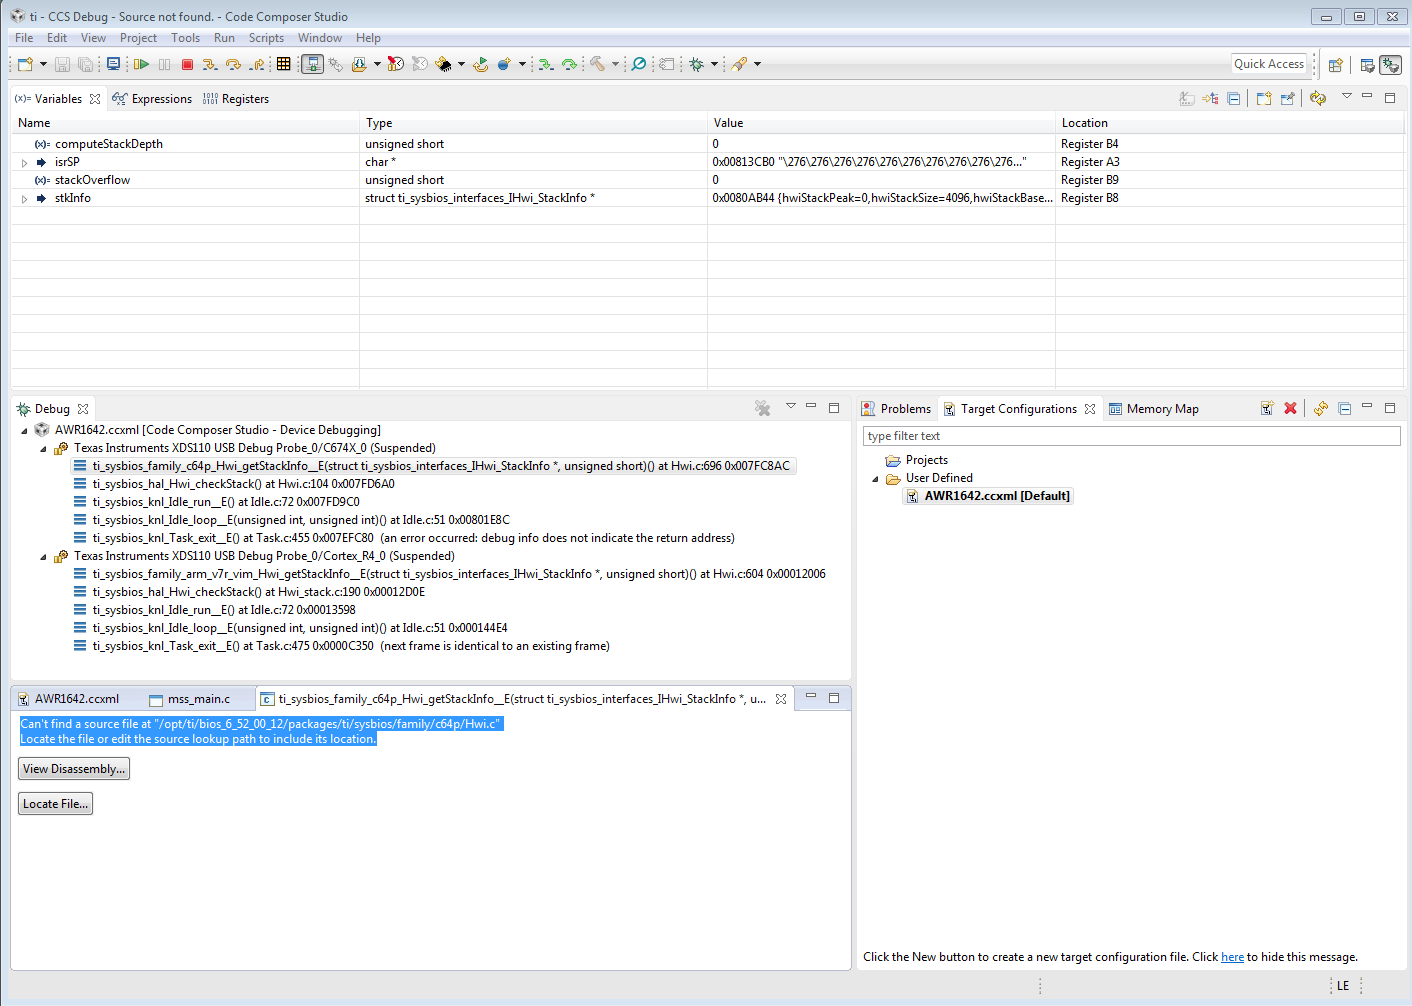
I am at the moment trying to complete the sdk_users_guide and I am encountering some problems with CCS while following the section "3.3 Capture demo for xWR16xx". Following the steps into the memory capture procedure (point 5), it explains how to connect CCS to the board. I managed to load the symbol files for Cortex_R4 and C674X_0, however I am encountering some problems to follow the next steps. When I try to connect my target in the debug window of CCS, i get some errors related to some files that the program can't find, for example:

Can't find a source file at "/opt/ti/bios_6_52_00_12/packages/ti/sysbios/family/c64p/Hwi.c"
Locate the file or edit the source lookup path to include its location.

Below there is a screenshot of the CCS window that I get.


I am not really sure of what could be the problem. I am trying to find the mentioned files and locate them for the program but I didn't managed yet... some help?


  • Carlos,

    In this case the message means that execution has halted inside the SYS/BIOS kernel (part of TI-RTOS). CCS knows the name of the source file associated with that location but is unable to find it. You will see these messages from time to time when execution stops inside system libraries.

    Regards,
    John
  • Good afternoon,

    At the moment I solved that problem but I run into another different one. Now I manage to run each of the two components of my board. (For the IWR1642 are C674X_0 and Cortex_R4_0)

    However I can't continue with the data gathering from the board. According to the sdk_users guide the next step would be to check in CCS Expressions window, view the global variable gCaptureMCB and check DMA interrupt counter(dmaIntCounter) and chirp interrupt counter(chirpIntCounter), to evaluate if they match the given configuration. However there is nothing appearing in my expressions tab.  I don't see any step that I could have skipped...

    As a possible clue, in the Disassembly window corresponding to the C674X I have listed a set of outputs that are driving me crazy:

    ......... ...
    007fc6d8:   ???? Could not read 0x007FC6D8: execution state prevented access [code=0x400000]
    007fc6dc:   ???? Could not read 0x007FC6DC: execution state prevented access [code=0x400000]
     98       {
    007fc6e0:   ???? Could not read 0x007FC6E0: execution state prevented access [code=0x400000]
    007fc6e4:   ???? Could not read 0x007FC6E4: execution state prevented access [code=0x400000]
    105           if (!Hwi_Module_startupDone()) {
    007fc6e8:   ???? Could not read 0x007FC6E8: execution state prevented access [code=0x400000]
    106               return (Startup_NOTDONE);
    007fc6ec:   ???? Could not read 0x007FC6EC: execution state prevented access [code=0x400000]
    007fc6f0:   ???? Could not read 0x007FC6F0: execution state prevented access [code=0x400000]
    149       }
    007fc6f4:   ???? Could not read 0x007FC6F4: execution state prevented access [code=0x400000]
    134           TSR |= (Exception_TSRXEN | Exception_TSRGEE);
    007fc6f8:   ???? Could not read 0x007FC6F8: execution state prevented access [code=0x400000]
    007fc6fc:   ???? Could not read 0x007FC6FC: execution state prevented access [code=0x400000]
    007fc700:   ???? Could not read 0x007FC700: execution state prevented access [code=0x400000]
    007fc704:   ???? Could not read 0x007FC704: execution state prevented access [code=0x400000]
    137           TSR &= ~(Exception_TSREXC);
    007fc708:   ???? Could not read 0x007FC708: execution state prevented access [code=0x400000]
    007fc70c:   ???? Could not read 0x007FC70C: execution state prevented access [code=0x400000]
    007fc710:   ???? Could not read 0x007FC710: execution state prevented access [code=0x400000]
    139           if (Exception_useInternalBuffer) {
    007fc714:   ???? Could not read 0x007FC714: execution state prevented access [code=0x400000]
    007fc718:   ???? Could not read 0x007FC718: execution state prevented access [code=0x400000]
    007fc71c:   ???? Could not read 0x007FC71C: execution state prevented access [code=0x400000]
    007fc720:   ???? Could not read 0x007FC720: execution state prevented access [code=0x400000]
    007fc724:   ???? Could not read 0x007FC724: execution state prevented access [code=0x400000]
    007fc728:   ???? Could not read 0x007FC728: execution state prevented access [code=0x400000]
    007fc72c:   ???? Could not read 0x007FC72C: execution state prevented access [code=0x400000]
    140               Exception_module->excPtr = (Char *)
    007fc730:   ???? Could not read 0x007FC730: execution state prevented access [code=0x400000]
    007fc734:   ???? Could not read 0x007FC734: execution state prevented access [code=0x400000]
    007fc738:   ???? Could not read 0x007FC738: execution state prevented access [code=0x400000]
    145               Exception_module->excPtr = ti_sysbios_family_c64p_Hwi_getIsrStackAddress();
    007fc73c:   ???? Could not read 0x007FC73C: execution state prevented access [code=0x400000]
    007fc740:   ???? Could not read 0x007FC740: execution state prevented access [code=0x400000]
    140               Exception_module->excPtr = (Char *)
    007fc744:   ???? Could not read 0x007FC744: execution state prevented access [code=0x400000]
    145               Exception_module->excPtr = ti_sysbios_family_c64p_Hwi_getIsrStackAddress();
    007fc748:   ???? Could not read 0x007FC748: execution state prevented access [code=0x400000]
    149       }
    007fc74c:   ???? Could not read 0x007FC74C: execution state prevented access [code=0x400000]
    145               Exception_module->excPtr = ti_sysbios_family_c64p_Hwi_getIsrStackAddress();
    007fc750:   ???? Could not read 0x007FC750: execution state prevented access [code=0x400000]
    148           return Startup_DONE;
    007fc754:   ???? Could not read 0x007FC754: execution state prevented access [code=0x400000]
    140               Exception_module->excPtr = (Char *)
    007fc758:   ???? Could not read 0x007FC758: execution state prevented access [code=0x400000]
    007fc75c:   ???? Could not read 0x007FC75C: execution state prevented access [code=0x400000]

    This list continues for an undefined time, so I guess it is generated while the program tries to read continuously from the board. Could you help me with this?

  • For the expressions view you have to add the expressions that you want to see values for. Click on "Add new expression" and then type the name of the variable that you want to see.

    As far as the disassembly view are you trying to view that while the cpu is running? The message means that the cpu is in a state that does not allow the debugger to read the location it is attempting to read.

    John