This thread has been locked.
If you have a related question, please click the "Ask a related question" button in the top right corner. The newly created question will be automatically linked to this question.
Tool/software: Code Composer Studio
Hello CCS forum,
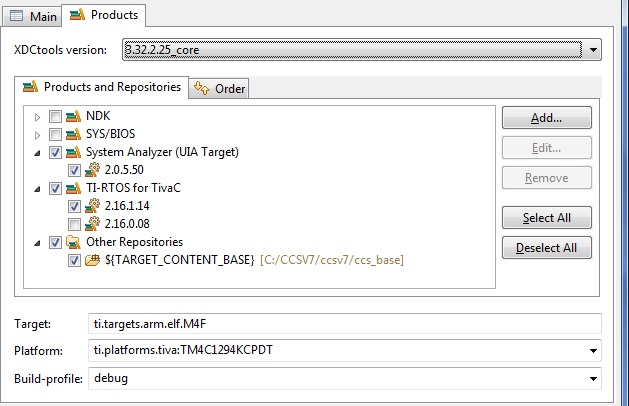
Recently updated CCS7 DVT and RTOS versions. The CPU load graph & Task graph (details) print yet both graphs remain blank . The execution graph only produces lines (CPU idle) and one of two running tasks and at very slow update rate. Live events on COM6, 115200 baud. Reverted the original project RTOS, XDC tools versions makes no difference, both CPU load, task graphs remain blank.
Recent DVT update suspected to breaking graphs:
DVT - Graph Visualization 4.1.0.201705251038 com.ti.dvt2.graph.visualization.feature.group Texas Instruments DVT UI Scripting 4.1.0.201705251038 com.ti.dvt2.scripting.ui.feature.group Texas Instruments DVT Core Components 4.1.0.201705251038 com.ti.dvt2.core.feature.group Texas Instruments DVT Common Components 4.1.0.201705251038 com.ti.dvt.common.feature.group Texas Instruments GEF (MVC) 3.11.0.201606061308 org.eclipse.gef.feature.group Eclipse GEF Draw2d 3.10.100.201606061308 org.eclipse.draw2d.feature.group Eclipse GEF DVT Core Components For CCStudio 4.1.0.201705251038 com.ti.dvt2.core.ccstudio.feature.group Texas Instruments
Any ideas what CCS7 module is giving this issue?
Which exact version of CCS are you using? I suspect the issue you are seeing may be related to the one in this thread.
I will test this again with CCS 7.3 tomorrow and let you know if I can reproduce the behavior.
I do see the CPU Load and Task Load graphs update when running on CCS 7.3. Please see screenshots below of the versions in my set up. I was running the stairstepStopMode example.
If you are on an earlier version of CCS than 7.3, there were some known issues in this area. I would suggest installing 7.3 (you could leave your current installation intact if you wish and install 7.3 in a different directory) and giving it a try.
Hi ArtiG,
How could CCSv7.0 be the issue when it produced graph data with earlier DVT - Graph Visualization 4.1.0.201612061750. Yes RTOS analyzer was a bit clunky but it did produce graph data in CCS7.0.
The update last week removed DVT 4.1.0.xxx1750 before installing DVT - Graph Visualization 4.1.0.201705251038.
You guys are regression testing DVT updates at least to the primary CCS verison, right?
CCS 7.3 comes with DVT 4.1.0.201708101502, which is a newer version than the one you have. There was a bug identified in an earlier version of DVT that impacted graph updates, and that should be resolved in this latest version.
Unfortunately CCS 7.3 (and its components) is not available as an update, as noted in the Download page.
Hence, you would need to do a full install of 7.3. I apologize for the inconvenience.