A related question is a question created from another question. When the related question is created, it will be automatically linked to the original question.
If you have a related question, please click the "Ask a related question" button in the top right corner. The newly created question will be automatically linked to this question.
How do you use call trace in CCS? For Example, if I put a break point inside the first line of a function or task, and it breaks, how do I tell who called it?
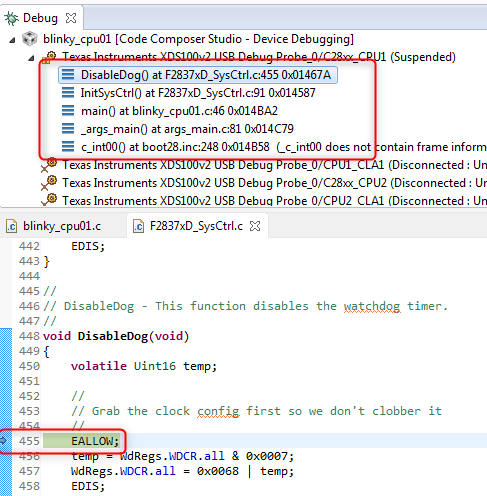
The call stack can be found in the Debug view, underneath the debug context:
In the example above, the application is currently halted in the DisableDog() function at line 455 of F2837xD_SysCtrl.c. As you can see in the call stack, that is the first entry. That first entry is where you are currently halted. The entry directly underneath it is the function that called DisableDog(). As you can see in the call stack, that would be InitSysCtrl() at line 91 of F2837xD_SysCtrl.c. By looking at the entry underneath that one, you can see that the main() function at line 46 of blinky_cpu1.c called InitStsCtrl(). And so on.