Part Number: TMDSSK3358
Tool/software: Code Composer Studio
Hi,
It seems breakpoints in startup_ARMCA8.S are ignored even if I put breakpoint to 'Branch to main' in startup_ARMCA8.S .
This thread has been locked.
If you have a related question, please click the "Ask a related question" button in the top right corner. The newly created question will be automatically linked to this question.
Part Number: TMDSSK3358
Tool/software: Code Composer Studio
Hi,
It seems breakpoints in startup_ARMCA8.S are ignored even if I put breakpoint to 'Branch to main' in startup_ARMCA8.S .
Hello,
How are you setting this breakpoint? And when? Also provide the exact CCS version you are using and the exact behavior you witness when you try to set the breakpoint. For example, explain what you mean by "ignored" (is the breakpoint successfully set but it never halts there? Or does the brekapoint never gets enabled?)
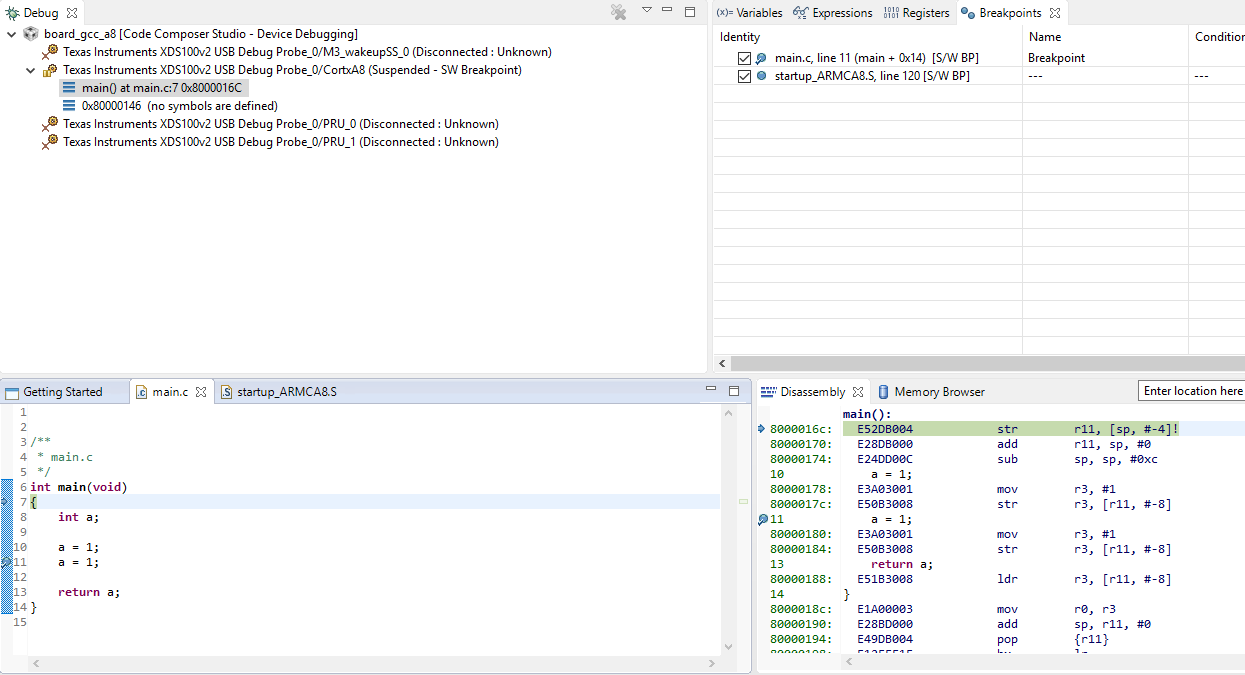
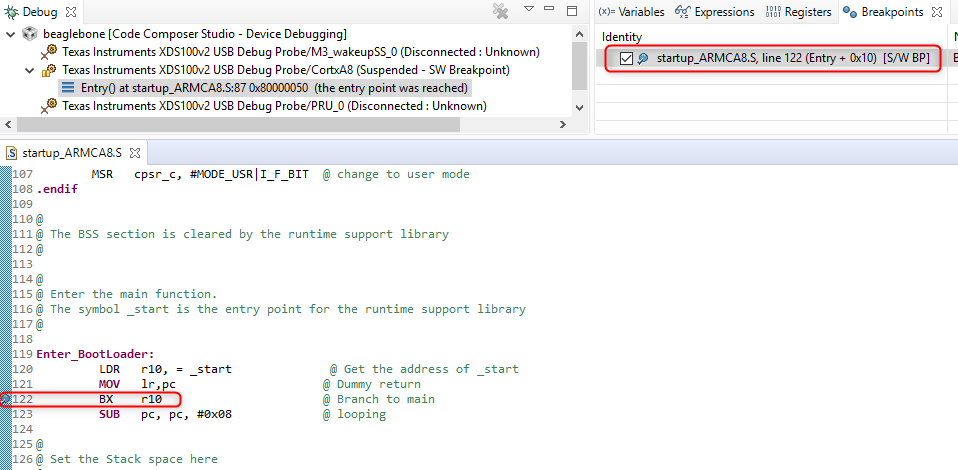
A screenshot of your environment would be helpful. One that shows the source file and the breakpoints view like below:
Thanks
ki
My CCS version: Version: 7.3.0.00019
Before debugging I have built the project and put two breakpoint: one in main.c, one in startup_ARMCA8.S . I start the debugging by pressing the Debug button. The debugger doesn't stop in startup_ARMCA8.S, it stops in main.c (at beginning of main) . When I press the Resume button the debugger stops at the breakpoint in main.c (this is correct) .
The screenshots:
My simple project (I have not changed the S, lds file )
Ok, (with help from the engineer) I've determined the root cause of this behavior.
If you set a breakpoint before a debug session has started and then start the debugger, CCS will try to automatically apply that breakpoint after the debugger has connected to the CPU.
However...
For multi-CPU targets (like many Sitara devices), this will not happen because the debugger does not know which CPU that breakpoint should be applied to. So it will leave it unattached.
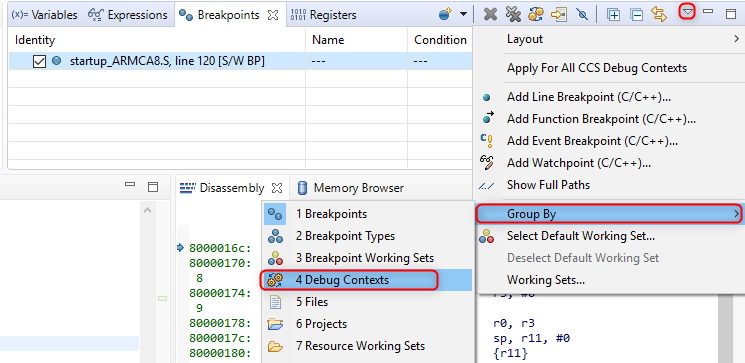
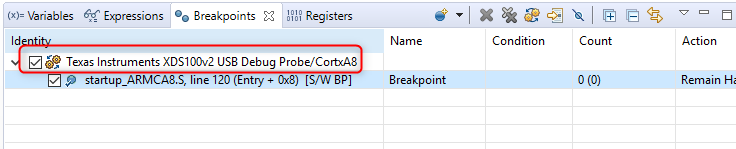
To check to see if the breakpoint is unattached, you can go to the menu for the Breakpoints view and group by Debug Contexts
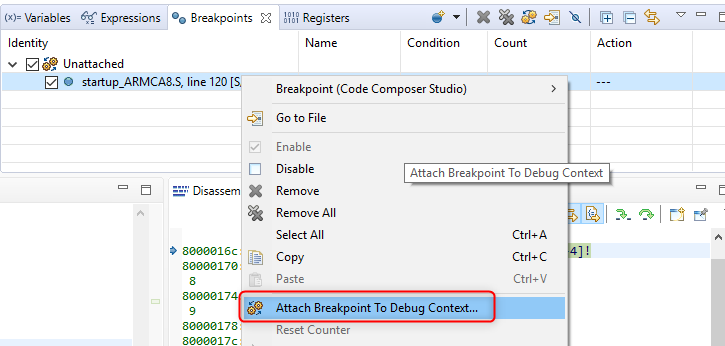
Note that in the screenshot below, you can see that the breakpoint is "unattached"
You can then "attach" the breakpoint to the current debug context via:
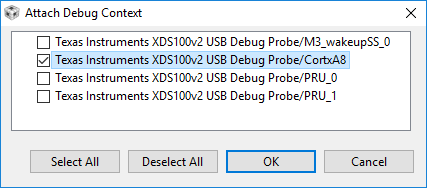
You will be prompted to choose the CPU to apply the breakpoint too:
Now the breakpoint will be applied (attached):
If you terminate the debugger and start another debug session, the breakpoints will be auto-attached to the same CPU again since it will remember you last setting. However, if you delete the breakpoints and then try to apply them again outside the debug session, the same steps will need to be repeated.
Note that because you have "auto-run to main" enabled, it will always run to main. You can always disable this if you wish to start at the entry point in the assembly file instead.
Thanks
ki