This thread has been locked.

If you have a related question, please click the "Ask a related question" button in the top right corner. The newly created question will be automatically linked to this question.

CCS/TM4C129ENCPDT: Slow single-stepping when using XDS110?

Part Number: TM4C129ENCPDT
Other Parts Discussed in Thread: EK-TM4C123GXL, , CC2640, SEGGER, CC1310, CC1350, CC3220SF, TM4C1294NCPDT, CC2640R2F, MSP432E401Y, TM4C123AH6PM, ALLIGATOR

Tool/software: Code Composer Studio

Single-stepping in the debugger is painfully slow with our XDS110. Each single-step takes from one second to several seconds.

In contrast, when we use the ICDI of a EK-TM4C123GXL to debug our board, it feels very snappy and quick. Each single-step takes a fraction of a second.

Being so slow, the XDS110 is hardly useful for debugging. Perhaps we need to configure it differently?

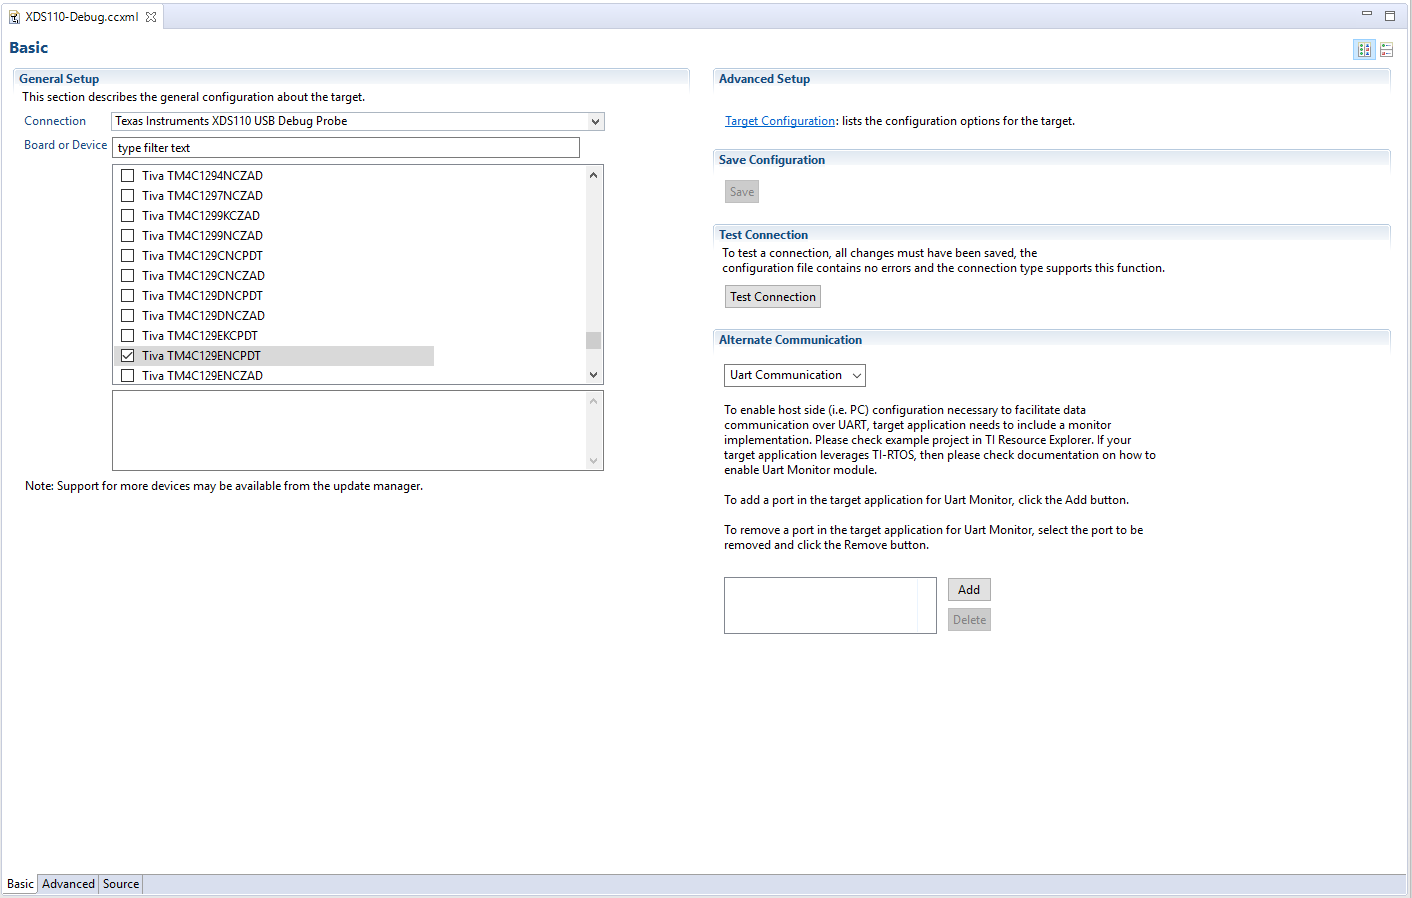
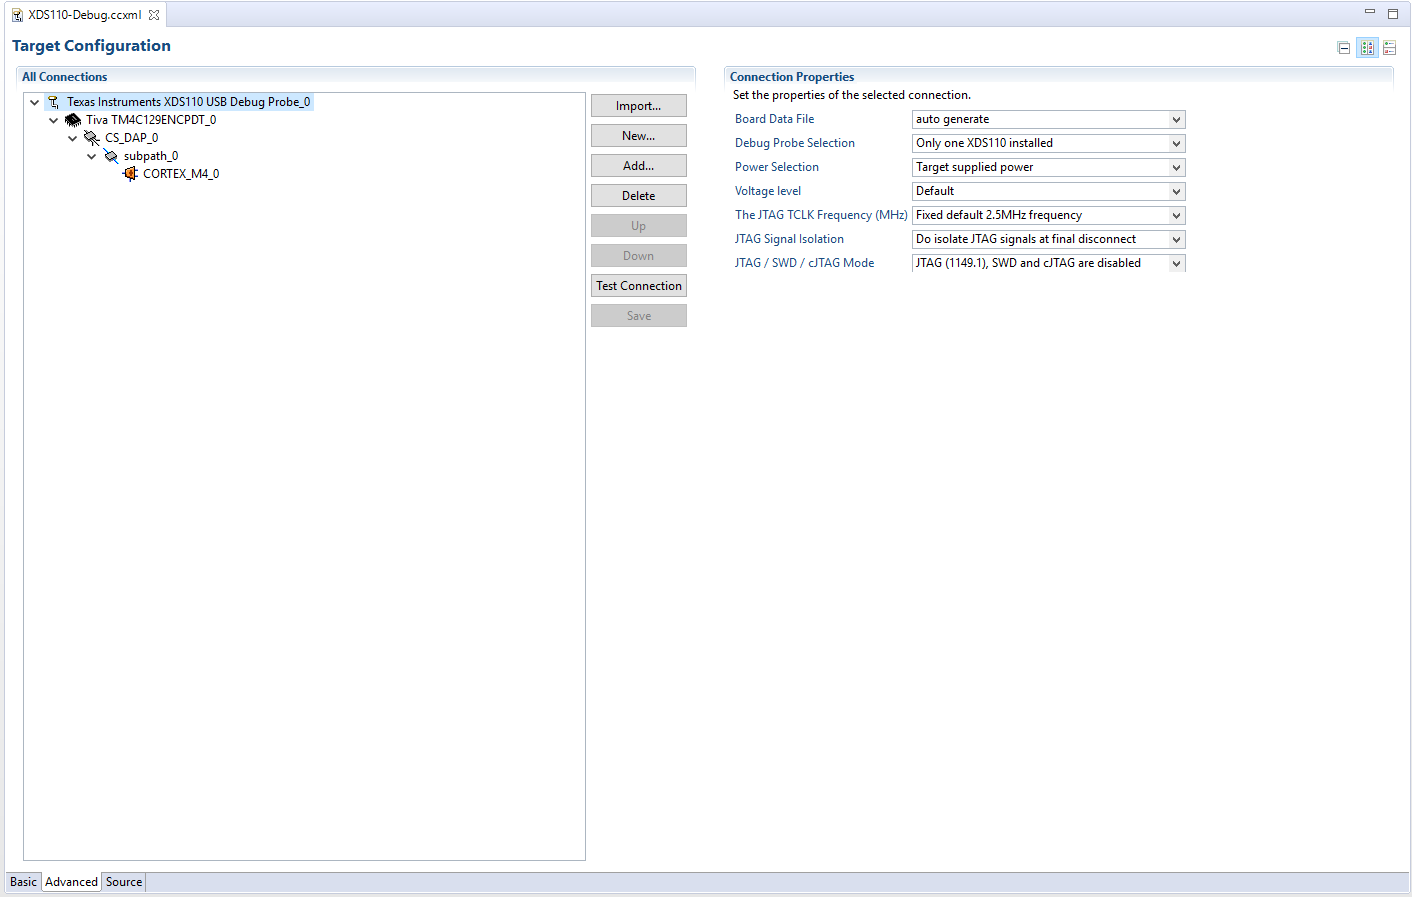
Currently our target configuration is as follows:

Debug Probe Selection: Only one XDS110 installed
Power Selection: Target supplied power
Voltage level: Default
The JTAG TCLK Frequency (MHz): Fixed default 2.5MHz frequency
JTAG Signal Isolation: Do isolate JTAG signals at final disconnect
JTAG / SWD / cJTAG Mode: We tried two different settings: "JTAG (1149.1), SWD and cJTAG are disabled" and "SWD Mode - Aux COM port is target TDO pin."

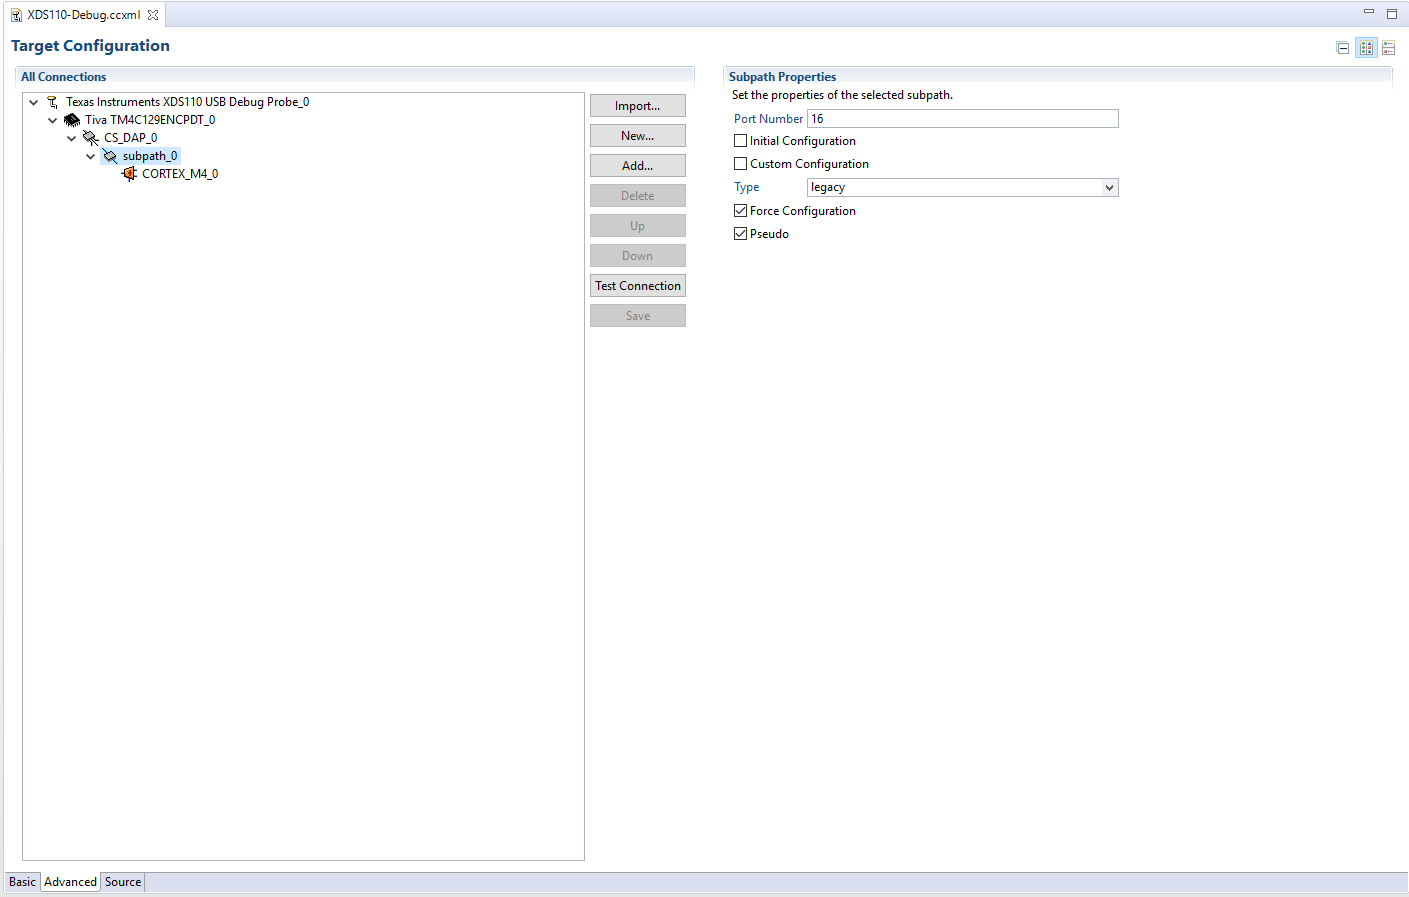
Subpath 0 properties:
Port Number: 16
Initial Configuration: NOT checked
Custom Configuration: NOT checked
Type: legacy
Force Configuration: Checked
Pseudo: Checked

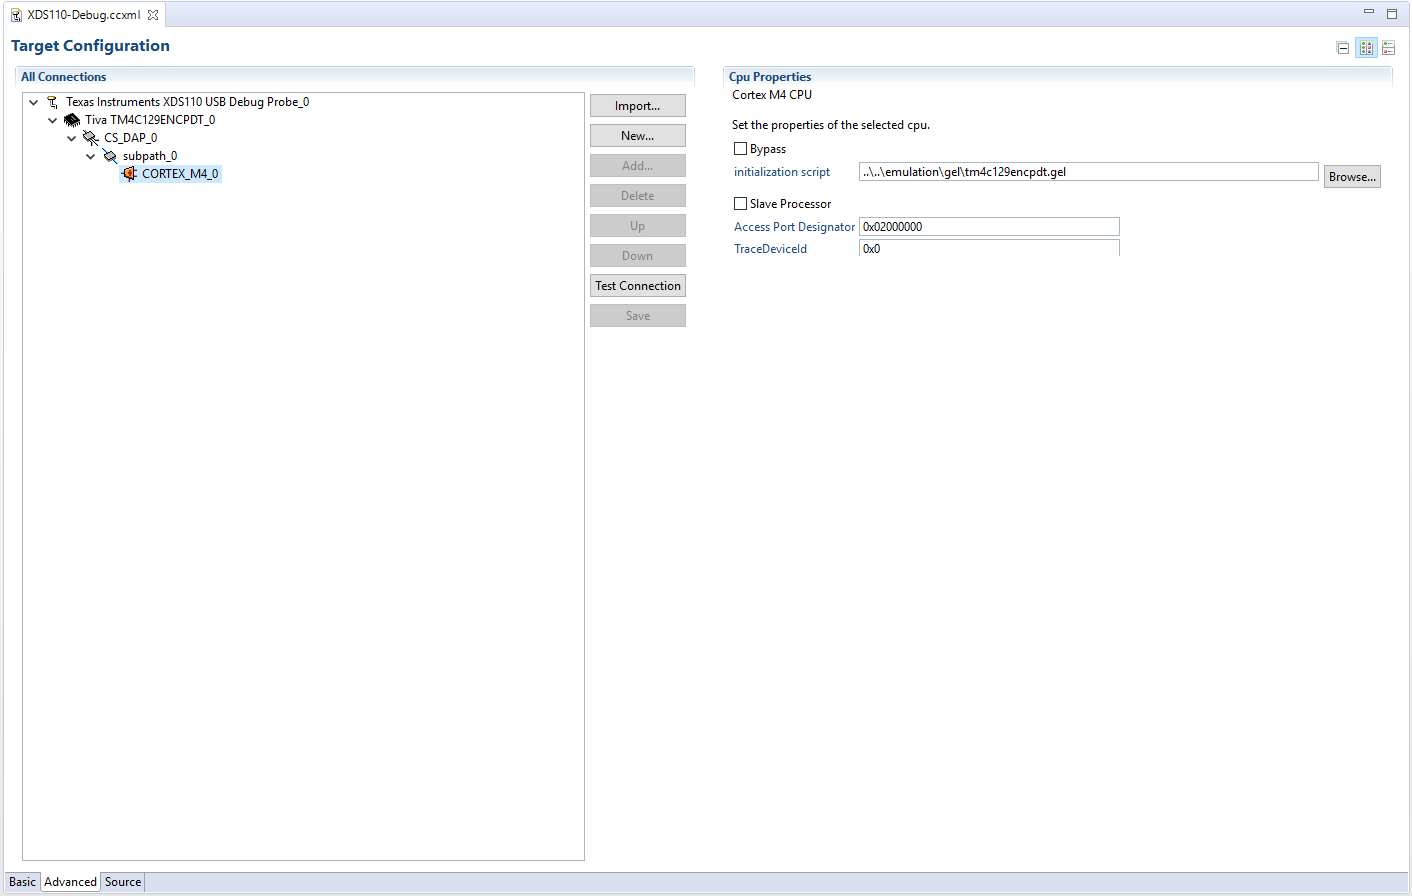
Cpu Properties (Cortex M4 CPU)
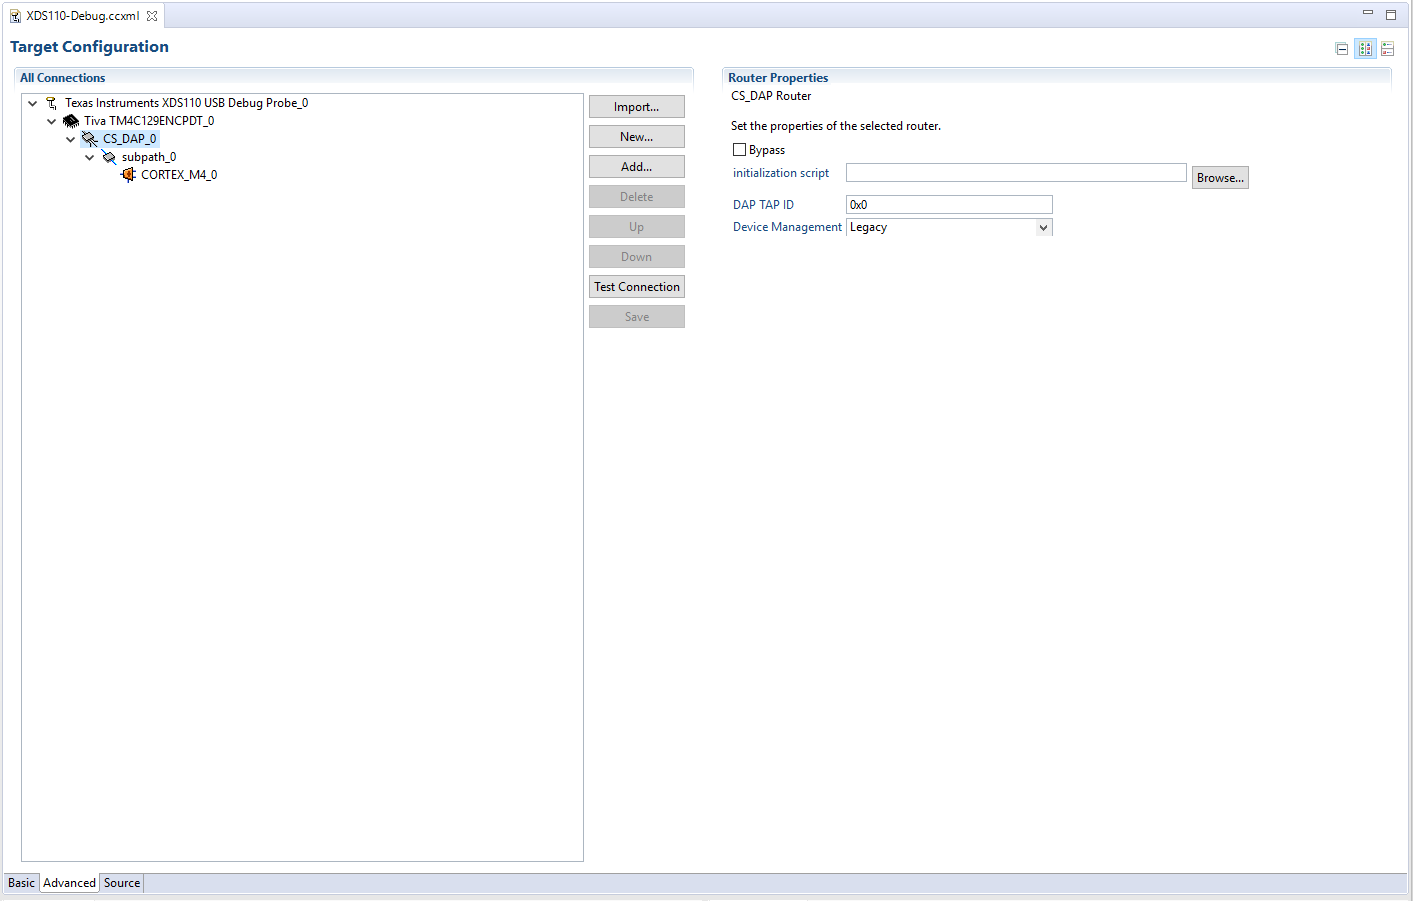
Bypass: NOT checked
Initialization script: "..\..\emulation\gel\tm4c129encpdt.gel"
Access Port Designator: 0x02000000
TraceDeviceId: 0x0

Our board exposes the following pins via a standard ARM 10-pin debug connector:

1 - Pulled up to VCC through 100 ohm 1/4W resistor
2 - TMS/SWDIO
3 - GND
4 - TCK/SWCLK
5 - GND
6 - TDO/SWO
7 - Not connected
8 - TDI
9 - GND
10 - RESET

Software version information: We are using CCS Version: 7.2.0.00013, Windows 10 x64 version 1709 build 16299.192, Java version 1.8.0_161.

  • Hi,

    I am not sure what may be happening in your case - a while ago I published several benchmarks with specific operations and the performance was quite comparable. check the detail at the page below.

    http://processors.wiki.ti.com/index.php/XDS_Performance_comparison 

    Just to double-check, I ran a few sessions with different programs (one of them is shown in the short clip below) and I couldn't spot any difference. I am using Windows 10/64 version 1603 with CCSv7.4.0 - but I don't recall anything relevant that was fixed and affected this particular combination of device/debug probe. 

    I will keep investigating this here and report back if I find anything relevant. 

    Regards,

    Rafael

  • Hi,

    I just tested the same setup on another machine with Windows 10/64 built 1709 and it worked quite well.

    Regards
    Rafael
  • Should we modify any of our settings that I listed above?

    What else in our setup should we check? E.g., in CCS, in Windows, in our hardware or software?
  • We have not been able to resolve our issue with extremely slow single-stepping when using the XDS110. How can we proceed?
  • desouza said:
    Hi,

    I just tested the same setup on another machine with Windows 10/64 built 1709 and it worked quite well.

    Regards
    Rafael

    Since you mentioned before that you were using CCS version 7.4.0, and we were using version 7.2.0, we went ahead and upgraded our installation to 7.4.0. In the meantime, Windows installed some updates as well.

    We then loaded our program to our TM4C129ENCPDT and single-stepped over a section of code using ICDI (using a modified EK-TM4C123GXL board). We then loaded the same program to the same part and single-stepped over the same section of code using the XDS110 debug probe. My colleagues agree that there is an obvious, significant difference in the speed of single-stepping. Whereas the ICDI interface is working properly and each single-step takes a very short fraction of a second, the XDS110 is taking over one second and in some cases clearly takes several seconds to make a single-step. This is the same outcome as with the earlier CCS version.

    We looked over your XDS Performance Comparison wiki page and it is clear that XDS110 performance is supposed to be quite good.

    There must be something about our configuration that is causing these issues but we have been unable to identify what it might be.


    Windows 10 Version 1709 Build 16299.214
    Java Version 1.8.0_161
    Code Composer Studio Version 7.4.0.00015

    Please ask if there is any other information you need.

    I will include screenshots of our setup:

  • having a similar slowness in debugging + FW download, using CC2640 Launchpad (XDS110), CCS 7.4, using a i7 Windows 7 desktop.
    Same launchpad burns quickly and debugs quickly, on a different i7 Windows 10 desktop. I can't seem to spot the difference in the configuration.
    The slowness appeared suddenly : the Windows 7 desktop burned the LaunchPad quickly, until it stopped, and the burn and debug became a very slow process.
    Tried to switch USB cables - no good.

    Seems the screenshots provided by twelve12pm are more than enough information for a TI employee to find something wrong in the configuration.

    Also, is there a TI command-line tool to test the XDS110 communication speed and errors, bypassing the CCS and project configuration?
  • I am glad to finally see some response on this thread, even if it is only a report of more troubles.

    I have so far been unsuccessful in locating the cause of this slow debugging. I had my boss order the XDS110 at whatever cost, and he is disappointed that I'm continuing to use the ICDI instead. But at such slow debugging speeds, it is not feasible to use the XDS110 when it takes upwards of 10 seconds per single-step, and that's when stepping over functions that the ICDI steps over in a fraction of a second.

    We purchased the XDS110 because it supports Trace, which ICDI does not. It was my intention to get several more XDS110 because (also unlike ICDI) they have unique identifiers so I can have one per CCS project and have each project program the correct board. As it is right now, I keep having to perform this frustrating dance of powering boards up and down, physically plugging and unplugging the ICDI between them, and opening/closing CCS projects because with the ICDI not having a unique identifier CCS sometimes gets confused and sends the executive from the wrong project, which could damage the boards, unless I close all but the one project I'm flash programming.

    So, bottom line, this is a big disappointment and I'd really appreciate some help diagnosing the issue.
  • twelve12pm said:
    Single-stepping in the debugger is painfully slow with our XDS110. Each single-step takes from one second to several seconds.

    Using the GEL code in CCS/SIMPLELINK-CC2640R2-SDK: Faster Debug Stepping? to measure the average time to step a program in a TM4C129NCPDT with different debug probes:

    Probe Connection Average step time
    Stellaris ICDI JTAG @ 1MHz 44 milliseconds (measured over 1000 steps)
    Segger J-Link JTAG @ 4MHz 9 milliseconds (measured over 10000 steps)
    Segger J-Link SWD @ 2MHz 11 milliseconds (measured over 10000 steps)
    XDS110 JTAG @ 2.5MHz 136 milliseconds (measured over 1000 steps)
    XDS110 SWD @ 2.5MHz 140 milliseconds (measured over 1000 steps)

    So, while the XDS110 was slower than the Stellaris ICDI or Segger J-Link, the XDS110 average step time will only of the order of 140 milliseconds which is faster than your case.

    The software used was:

    - Windows 10 Pro version 1709 OS Build 16299.248
    - CCS 7.4.0.00015
    - TI Emulators 7.0.100.1
    - SEGGER J-Link Support (Windows) 6.30.3.0

    I am not aware of a configuration setting which would cause the step time of the XDS110 to be from one seconds to several seconds.

    Maybe if you enable Debug Server Logging and post the log file for an example where the XDS110 single stepping is slow, that might identify which part of the software is causing the slow operation.

  • Dear Chester,

    Thank you for your reply. Even though your chart shows XDS110 taking 140 ms rather than the ICDI 44 ms, you're right that this should not result in such a noticeable difference as what I'm experiencing.

    I was not aware of Debug Server Logging.

    At my next debug session I will take the opportunity to gather some log information and post it here.

    Thanks again
  • Hi guys,

    I am having the same problem using CCS 7.4.0.00015 on a CC1310 Launchpad. It's completely unusable. I have attached a log from the debug server.

    Regards,

    Mike6433.ds1.zip

  • Thank you for your reply and for posting your debug log.

    It seems there are at least three of us with these slow debug issues.

    I have not gotten my own debug log posted yet but that is on my to-do list and I will do so soon.
  • Hi everyone,

    Please apologize for disappearing. I have been swamped here in the last weeks but yesterday and today I found some time to test some additional scenarios and theories. Unfortunately at this point I cannot tell what is happening given that I am unable to reproduce this in any of my hosts.

    The test environments and configurations tested were:
    - TI Emulators package 7.0.100.0 with XDS110 firmware version 2.3.0.11 on CCSv7.4.0
    - XDS110 Standalone with MSP432P401R, TM4C1294NCPDT, CC3220SF and CC1350
    - XDS110 embedded into the launchpads for CC1350, CC1352, CC2640R2F, CC3220SF, MSP432P401R and MSP432E401Y
    - Windows 7/64, Windows 10/1609 and Windows 10/1709, as well as Ubuntu 16.04 and macOS High Sierra but not as thoroughly

    Although I haven't got seconds between step operations, the details I noticed that could influence this and other operations are:
    - Antivirus/Antimalware hard disk scan running in the background impacted the entire debug experience (launch, terminate, program load, step, memory and disassembly display, graphs, etc.) - this obviously impacted everything else on the system.
    - CCS background processes such as Project Migration, Workspace Refresh, Crash Report Job and, at a lesser extent, the C/C++ Indexer caused an overall slowdown of CCS itself, but only for a limited time while these operations took their time to complete. Out of all these, the C/C++ Indexer was the one that took the longer time to complete. The time and impact these processes had on the IDE are heavily dependent on the number of opened projects in the workspace, as well as if source files are local, networked or version controlled.
    - Multiple XDS110s connected to the host did not influence the step operation performance.
    - The amount and size of data-intensive views (one or more memory browser view, Expressions or Variables with multiple items shown) significantly impacted the speed of the step operations. This is expected as the traffic between the target and the host is increased when compared to a debug session without any opened views.
    - Although I tested C Single-step operations as well, I am basing all my comparisons with Assembly Single-step operations, as they are the common denominator to accurately know the performance of a single step operation. A single step in C may execute a large number of assembly operations under the hood.
    - I did not test code with active ISRs; only on rare cases I have seen in the past they actually impacted the performance of the debugger (and none with a Cortex core).
    - I tested the step operations both before and after the device's System Clock was set (when this was available on the example code I used). Although I haven't seen significant differences, there is always a possibility that a mismatched configuration could cause the Debug Probe to somehow be out of sync with the device.

    The other settings on the screenshots shown by the OP do not affect the performance of step operations. Also, any system installed JVMs do not influence the operation of CCS, which ships with its own precisely to avoid any potential incompatibilities.

    Thanks for sending the debug logs. Although they only report higher level interactions at the host side and not low-level interactions on the wire, they may help bring any additional ideas to the table.

    If there is a suspicion of a flaky cable or connection, try to issue the test I mention in the post below:
    e2e.ti.com/.../2447276

    Unfortunately at this moment I really can't tell what is happening, but hopefully the Debug Server logs can bring additional light to the issue. In the meantime I will try to see additional conditions that may be causing this.

    I apologize for the inconvenience,
    Rafael
  • Dear Rafael,

    Thank you very much for your reply. I am glad to know that we have not been forsaken! Your post is very informative and I am going to look into all of the possibilities you mentioned. If any others come to mind please let us know!

    Thank you for mentioning the dbgjtag utility and linking to your example. That is going to be my first test!

    If that isn't the cause, then I'll look into the other possibilities -- antivirus, CCS background processes, data-intensive views. Although I doubt if any of these are the cause because the ICDI debugging worked at "normal" speed, and I switched back and forth between ICDI and XDS110 a few times. We have only one XDS110 at this time, ruling out any possible issue with multiple simultaneous XDS110; however I will retry with other USB devices disconnected (including any ICDI devices). Also, I believe that none of our ISRs are taking long enough to fool the debugger into thinking that code has locked up, but this is another issue that can be checked easily by toggling one of our "testpoint" GPIOs on entry/exit of ISRs and measuring with the oscilloscope.

    We are setting system clock to the maximum (120 MHz on TM4C129ENCPDT, 80 MHz on TM4C123AH6PM) but I do recall seeing something about the system clock setting affecting debugging in some way. I cannot recall at the moment what that was -- unless it wasn't debug, but trace timing that gets thrown off if the clock is changed during trace. Yes, I think that was it.

    It's good to know that CCS is installing its own private JVM. I was unaware of that.

    Thank you again for your very informative post and for taking what was obviously significant time to look into the XDS110 issue. I'll be back soon with results of our tests.
  • desouza said:
    Hi everyone,

    If there is a suspicion of a flaky cable or connection, try to issue the test I mention in the post below:
    e2e.ti.com/.../2447276
     

    I ran the dbgjtag utility with this command line, copied from your post above:

    C:\ti\ccsv7\ccs_base\common\uscif>dbgjtag -f @xds110 -rv -o -S brokenpath,repeat=10000

    I assume that running this test requires a target connected to the XDS110. I first ran it without a target and it immediately quit with the SC_ERR_PATH_BROKEN error. So I next ran it connected to our development board. When I ran it with a target, it hanged for quite some time (10,000 tests, after all) and produced this output:

    C:\ti\ccsv7\ccs_base\common\uscif>dbgjtag -f @xds110 -rv -o -S brokenpath,repeat=10000
    
    -----[Print the board config pathname(s)]------------------------------------
    
    xds110.i
    
    -----[Print the reset-command software log-file]-----------------------------
    
    This utility has selected a 100- or 510-class product.
    This utility will load the adapter 'jioxds110.dll'.
    The library build date was 'Dec 11 2017'.
    The library build time was '12:04:14'.
    The library package version is '7.0.100.1'.
    The library component version is '35.35.0.0'.
    The controller does not use a programmable FPGA.
    The controller has a version number of '5' (0x00000005).
    The controller has an insertion length of '0' (0x00000000).
    This utility will attempt to reset the controller.
    This utility has successfully reset the controller.
    
    -----[Print the reset-command hardware log-file]-----------------------------
    
    The scan-path will be reset by toggling the JTAG TRST signal.
    The controller is the XDS110 with USB interface.
    The link from controller to target is direct (without cable).
    The software is configured for XDS110 features.
    The controller cannot monitor the value on the EMU[0] pin.
    The controller cannot monitor the value on the EMU[1] pin.
    The controller cannot control the timing on output pins.
    The controller cannot control the timing on input pins.
    The scan-path link-delay has been set to exactly '0' (0x0000).
    
    -----[Perform the Broken Path scan-test on the JTAG IR]----------------------
    
    This test will use blocks of 64 32-bit words.
    This test will be applied 10000 times.
    
    Do a test using 0xFFFFFFFF.
    Do a test using 0x00000000.
    All of the values were scanned correctly.
    
    The JTAG IR Broken Path scan-test has succeeded.
    
    -----[Perform the Broken Path scan-test on the JTAG DR]----------------------
    
    This test will use blocks of 64 32-bit words.
    This test will be applied 10000 times.
    
    Do a test using 0xFFFFFFFF.
    Do a test using 0x00000000.
    All of the values were scanned correctly.
    
    The JTAG DR Broken Path scan-test has succeeded.
    
    C:\ti\ccsv7\ccs_base\common\uscif>

    During this time, I tried shaking the USB cable, the XDS110, and the target board, to see if loose connections are playing a role. The test succeeded despite those attempts.

    Meanwhile by searching the SC_ERR_PATH_BROKEN error I mentioned earlier, I located this e2e post:

    https://e2e.ti.com/support/arm/automotive_processors/f/1021/t/656760

    Which led to this wiki page:

    http://processors.wiki.ti.com/index.php/Debugging_JTAG_Connectivity_Problems

    Which is unmaintained but links to this page:

    http://software-dl.ti.com/ccs/esd/documents/ccsv7_debugging_jtag_connectivity_issues.html

    So at this time I am working through that document to see what else I can come up with.

    I will soon check the other possibilities you mentioned.

  • I forgot to mention:

    In addition to the test passing despite shaking of cables and whatnot, I think loose connections are not the culprit here because the debugging speed (time it takes for each single-step) was consistently slow with the XDS110. It wasn't snappy one moment and then sluggish the next.

    Are there other useful tests I can execute with the dbgjtag utility and/or other utilities in that directory?

    Also how can I determine whether my XDS110 has the correct firmware version?
  • Hi,

    >>In addition to the test passing despite shaking of cables and whatnot, I think loose connections are not the culprit here because the debugging speed (time it takes for each single-step) was consistently slow with the XDS110.
    My main theory is that flaky connections tend to cause excessive data retries and therefore causing overall delays on the data communications. I had hoped the dbgjtag could potentially indicate this could have been the issue.

    Thinking about that brought me an additional idea: if your custom board is using an external power supply, can you verify if there are no ground loops between the host PC power supply --> USB port --> XDS110 --> Board --> board power supply --> host PC power supply? I have seen these ground loops introduce noise that caused instability or sometimes even a complete inability to connect to a device. Still in this same subject, be mindful of any ground alligator clips of test equipment (oscilloscopes, function generators, etc.), which are usually tied to ground at the outlet.

    >>Also how can I determine whether my XDS110 has the correct firmware version?
    Usually issue a command xdsdfu -e from the proper install directory. Check section 7 of the following page:
    processors.wiki.ti.com/.../XDS110

    Two additional very loosely related ideas are:
    - Update the TI Emulators component of your CCS (go to menu Help --> Check for Updates and you should see a component called TI Emulators 7.0.188.0)
    - Try the tips shown in sections 4 and 6 of the page below:
    processors.wiki.ti.com/.../Troubleshooting_CCSv7

    Regards,
    Rafael
  • As mentioned previously I am having similar problems but am using a CC1310 Launchpad. I have now done a clean install of CCS 7.4.0.00015 on Ubuntu 16.04 LTS and have the same problem. I was on Windows 10 previously. One thing that may be be a pointer is that I am using an external makefile and loading the resulting .elf with the debugger. I pass the -g flag to the linker to create the symbols in the .elf. I am trying to use CCS to debug a contiki-ng application.

    Regards,

    Mike

  • We are working through the information in earlier posts and will be back soon to report what we find.
  • Koby Fruchtnis14 said:
    Also, is there a TI command-line tool to test the XDS110 communication speed and errors, bypassing the CCS and project configuration?

    Not that I am aware of.

    Some options to perform such test are:

    1) Use Debug Server Scripting (DSS). The Step comparison on the Debug Probe Performance Comparison was performed using DSS. I can't seem to find the DSS scripts used, but asked if they are available in https://e2e.ti.com/support/development_tools/code_composer_studio/f/81/t/668747. Using DSS would bypass the CSS GUI.

    2) Create a program using the Generic Target Interface (GTI) API. TI Emulators 7.0.188.0 which has just been released for CCS 7.4 has made the GTI API public and contains some examples (see CCS installation directory>\ccsv7\ccs_base\emulation\doc\gti_api.zip). Using the GTI API bypasses the CSS GUI and Debug Server, but requires more knowledge of the target hardware.