This thread has been locked.

If you have a related question, please click the "Ask a related question" button in the top right corner. The newly created question will be automatically linked to this question.

CCS/TM4C123GH6PM: XDS100v2 Debugging Issue

Part Number: TM4C123GH6PM
Other Parts Discussed in Thread: UNIFLASH, SEGGER

Tool/software: Code Composer Studio

Hello,

I am having an issue when trying to debug a project using a Blackhawk XDS100 v2 ARM.  Nothing has changed in the project since I was able to connect last time.  I know my target board is good, since I can use our production programmer to load a program.

The error message I get is:

(Error -1265 @ 0x0)

Device ID is not recognized or is not supported by driver.

My CCS version  Version: 5.4.0.00091.  I have tried re-installing CCS, using different cables and XDS100 v2 programmers to no avail.  

Are there any other troubleshooting steps you can recommend?

Thanks,

Chris

  • Hello Chris,

    Chris Radzik said:
    Nothing has changed in the project since I was able to connect last time.

    When was the last time you did connect successfully?

    Chris Radzik said:
    I can use our production programmer to load a program.

    Is this a custom production programmer or are you using something from TI like UniFlash?

    Chris Radzik said:

    (Error -1265 @ 0x0)

    Device ID is not recognized or is not supported by driver.

    There are several potential causes of this issue:

    1) Device is locked

    2) Invalid target configuration file (is the CCS target configuration file identical to the last time you successfully connected?)

    3) HW issue with the device, JTAG connection, or debug probe

    Since you tried using different cables and probes, and since you can connect to the target via alternate programmer, I am going to guess that #3 is not an issue.

    Chris Radzik said:
    My CCS version  Version: 5.4.0.00091.

    This is pretty old (and unsupported) version. Any chance you can upgrade to the latest version?

    Thanks

    ki

  • I was able to connect about 3 months ago.

    The production programmer is a Segger Flasher ARM.

    The Target Config file has not changed. The connection is set for "Texas Instruments XDS100v2 USB Emulator" . The device was still set for the legacy part number (LM4F230H5QR). I tried changing it to the correct TIVA part number also that also did not work.

    I downloaded CCS Version: 7.4.0.00015, and made a new Target config for the part.

    This is the error I get when I try to test the connection.

    [Start: Texas Instruments XDS100v2 USB Debug Probe_0]

    Execute the command:

    %ccs_base%/common/uscif/dbgjtag -f %boarddatafile% -rv -o -F inform,logfile=yes -S pathlength -S integrity

    [Result]


    -----[Print the board config pathname(s)]------------------------------------

    C:\Users\cradzik\AppData\Local\TEXASI~1\
    CCS\ti\0\0\BrdDat\testBoard.dat

    -----[Print the reset-command software log-file]-----------------------------

    This utility has selected a 100- or 510-class product.
    This utility will load the adapter 'jioserdesusb.dll'.
    The library build date was 'Nov 6 2017'.
    The library build time was '10:36:36'.
    The library package version is '7.0.100.0'.
    The library component version is '35.35.0.0'.
    The controller does not use a programmable FPGA.
    The controller has a version number of '4' (0x00000004).
    The controller has an insertion length of '0' (0x00000000).
    This utility will attempt to reset the controller.
    This utility has successfully reset the controller.

    -----[Print the reset-command hardware log-file]-----------------------------

    The scan-path will be reset by toggling the JTAG TRST signal.
    The controller is the FTDI FT2232 with USB interface.
    The link from controller to target is direct (without cable).
    The software is configured for FTDI FT2232 features.
    The controller cannot monitor the value on the EMU[0] pin.
    The controller cannot monitor the value on the EMU[1] pin.
    The controller cannot control the timing on output pins.
    The controller cannot control the timing on input pins.
    The scan-path link-delay has been set to exactly '0' (0x0000).

    -----[The log-file for the JTAG TCLK output generated from the PLL]----------

    There is no hardware for programming the JTAG TCLK frequency.

    -----[Measure the source and frequency of the final JTAG TCLKR input]--------

    There is no hardware for measuring the JTAG TCLK frequency.

    -----[Perform the standard path-length test on the JTAG IR and DR]-----------

    This path-length test uses blocks of 64 32-bit words.

    The test for the JTAG IR instruction path-length failed.
    The JTAG IR instruction scan-path is stuck-at-zero.

    The test for the JTAG DR bypass path-length failed.
    The JTAG DR bypass scan-path is stuck-at-zero.

    -----[Perform the Integrity scan-test on the JTAG IR]------------------------

    This test will use blocks of 64 32-bit words.
    This test will be applied just once.

    Do a test using 0xFFFFFFFF.
    Test 1 Word 0: scanned out 0xFFFFFFFF and scanned in 0x00000000.
    Test 1 Word 1: scanned out 0xFFFFFFFF and scanned in 0x00000000.
    Test 1 Word 2: scanned out 0xFFFFFFFF and scanned in 0x00000000.
    Test 1 Word 3: scanned out 0xFFFFFFFF and scanned in 0x00000000.
    Test 1 Word 4: scanned out 0xFFFFFFFF and scanned in 0x00000000.
    Test 1 Word 5: scanned out 0xFFFFFFFF and scanned in 0x00000000.
    Test 1 Word 6: scanned out 0xFFFFFFFF and scanned in 0x00000000.
    Test 1 Word 7: scanned out 0xFFFFFFFF and scanned in 0x00000000.
    The details of the first 8 errors have been provided.
    The utility will now report only the count of failed tests.
    Scan tests: 1, skipped: 0, failed: 1
    Do a test using 0x00000000.
    Scan tests: 2, skipped: 0, failed: 1
    Do a test using 0xFE03E0E2.
    Scan tests: 3, skipped: 0, failed: 2
    Do a test using 0x01FC1F1D.
    Scan tests: 4, skipped: 0, failed: 3
    Do a test using 0x5533CCAA.
    Scan tests: 5, skipped: 0, failed: 4
    Do a test using 0xAACC3355.
    Scan tests: 6, skipped: 0, failed: 5
    Some of the values were corrupted - 83.3 percent.

    The JTAG IR Integrity scan-test has failed.

    -----[Perform the Integrity scan-test on the JTAG DR]------------------------

    This test will use blocks of 64 32-bit words.
    This test will be applied just once.

    Do a test using 0xFFFFFFFF.
    Test 1 Word 0: scanned out 0xFFFFFFFF and scanned in 0x00000000.
    Test 1 Word 1: scanned out 0xFFFFFFFF and scanned in 0x00000000.
    Test 1 Word 2: scanned out 0xFFFFFFFF and scanned in 0x00000000.
    Test 1 Word 3: scanned out 0xFFFFFFFF and scanned in 0x00000000.
    Test 1 Word 4: scanned out 0xFFFFFFFF and scanned in 0x00000000.
    Test 1 Word 5: scanned out 0xFFFFFFFF and scanned in 0x00000000.
    Test 1 Word 6: scanned out 0xFFFFFFFF and scanned in 0x00000000.
    Test 1 Word 7: scanned out 0xFFFFFFFF and scanned in 0x00000000.
    The details of the first 8 errors have been provided.
    The utility will now report only the count of failed tests.
    Scan tests: 1, skipped: 0, failed: 1
    Do a test using 0x00000000.
    Scan tests: 2, skipped: 0, failed: 1
    Do a test using 0xFE03E0E2.
    Scan tests: 3, skipped: 0, failed: 2
    Do a test using 0x01FC1F1D.
    Scan tests: 4, skipped: 0, failed: 3
    Do a test using 0x5533CCAA.
    Scan tests: 5, skipped: 0, failed: 4
    Do a test using 0xAACC3355.
    Scan tests: 6, skipped: 0, failed: 5
    Some of the values were corrupted - 83.3 percent.

    The JTAG DR Integrity scan-test has failed.

    [End: Texas Instruments XDS100v2 USB Debug Probe_0]
  • Chris Radzik said:
    The test for the JTAG IR instruction path-length failed.
    The JTAG IR instruction scan-path is stuck-at-zero.

    The test for the JTAG DR bypass path-length failed.
    The JTAG DR bypass scan-path is stuck-at-zero.

    This is a low level error where basic connectivity on the JTAG scan chain is faulty. It is often not a tools issue but some low level HW issue.

    http://software-dl.ti.com/ccs/esd/documents/ccsv7_debugging_jtag_connectivity_issues.html#invalid-data-read-back

    But you mention that the SEGGER JTAG programmer works so this confuses things.

    One thing to try is to lower your JTAG TCLK setting:

    https://www.youtube.com/embed/mKxaztkCsYw

    I will need some more insight from the emulation experts. I will keep you posted of my findings

    Thanks

    ki

  • A colleague of mine who is more knowledgeable regarding our JTAG debug probes recommended checking to see if TCK and RTCK is shorted. Segger will work if it is not but not our XDS debug probes:

    dev.ti.com/.../

    Thanks
    ki
  • I checked the pins, and they are not shorted together.  For both XDS and Segger we are using this adapter (and have been for many years):

    www.tag-connect.com/TC2050-ARM2010

    with this cable:

    www.tag-connect.com/TC2050-IDC-NL 

    I've tried different cables and adapters.

  • Chris Radzik said:
    I checked the pins, and they are not shorted together.

    The information I received is that they should be shorted when using XDS debug probe

  • I shorted them together, and still have the same error.
  • I also just tried slowing down the clock to 100khz, and it did not help.  The Segger programmer is set for 1.2Mhz clock and works fine.

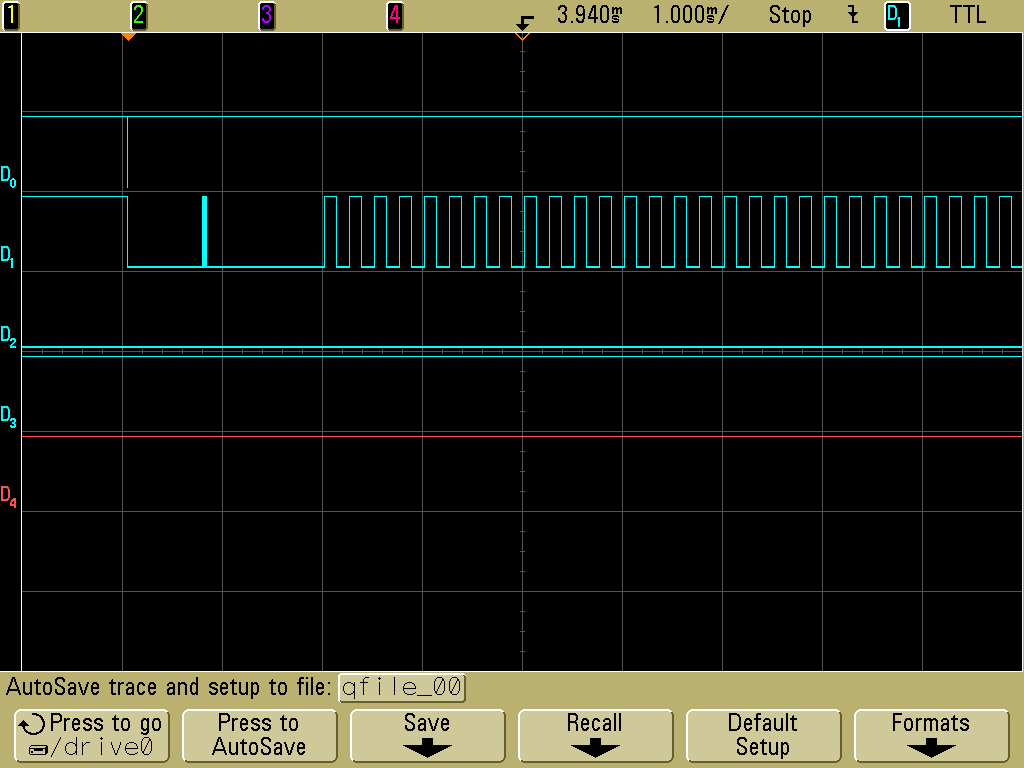
    I also have attached screen grabs of my scope on all the programming lines:

    D0=TMS

    D1=TCK

    D1=TDI

    D1=TDO

    D4=RESET

    This is the XDS starting the Test Connection via the Target Config Menu

    Here is the Segger starting programming:

  • Hi Chris,
    Thanks for checking and also for the screenshots. I will need to pull in an emulation expert for more analysis. Sorry for the delay and thank you for your patience

    ki
  • Chris,

    Please apologize for the delay; Ki is out in vacation and I ended up not being able to get to this thread.

    Looking at the screenshot for Segger it seems the transmission is being triggered on the rising edge of TMS, which is odd.

    I would be suspicious that your device was in SWD mode and it was confusing the XDS100v2, but from your capture all four lines are being activated, thus ruling this out.

    At this point I can't necessarily know what may be happening in your case. If you can extract the part of the schematics that connects the JTAG connector to the device (including all PUs and PDs) that would be helpful. You can also compare with the section "Single Device Non-buffered Configuration" of the Target Connection Guide that Ki sent before, which is what I would do as well.

    I send at the end of this post a capture of a successful "Test Connection" that I did a few years ago for comparison (done on a F28x device using a XDS100v1 at 1MHz).  Perhaps it helps to shine a light on the data captures you are getting.

    Another idea is to use an oscilloscope instead of a Logic Analyzer - who knows? Maybe there is noise happening on the line that is not being picked by the LA.

    Hope this helps,

    Rafael


    This is a capture of the entire "Test Connection" phase on my F28335 Experimenter's Kit (XDS100v1). I am triggering on the first falling edge of TMS, which usually corresponds to the first transaction on the JTAG flow (check this reference). You can notice how the initial transaction happens at about 20ms and the actual data transfer (the tests that are failing in your case) are in the middle of the screen - around 0.6~0.7s after.

    CH1: TMS  CH2: TCK, CH3:TDO, CH4:TDI

    This is a zoom into the initial transaction phase (200us/div). Notice the trigger at the falling edge of the TMS.

    These are two zoomed images into the final data transfer phase (5ms/div and 2ms/div). 

    5ms/div - the entire data transfer test

    2ms/div - a zoom into the initial phase of the data transfer test

  • Hi,

    It's been almost a month that this thread has seen any activity and will be closed. If you have any additional comments, please feel free to reply to it.

    Regards,
    Rafael