Part Number: AM5728
Tool/software: Code Composer Studio
Hello,
I am debugging a prime number generator program on bare metal on AM752x EVM board. I am using Blackhawk XDS 560v2 for the same.
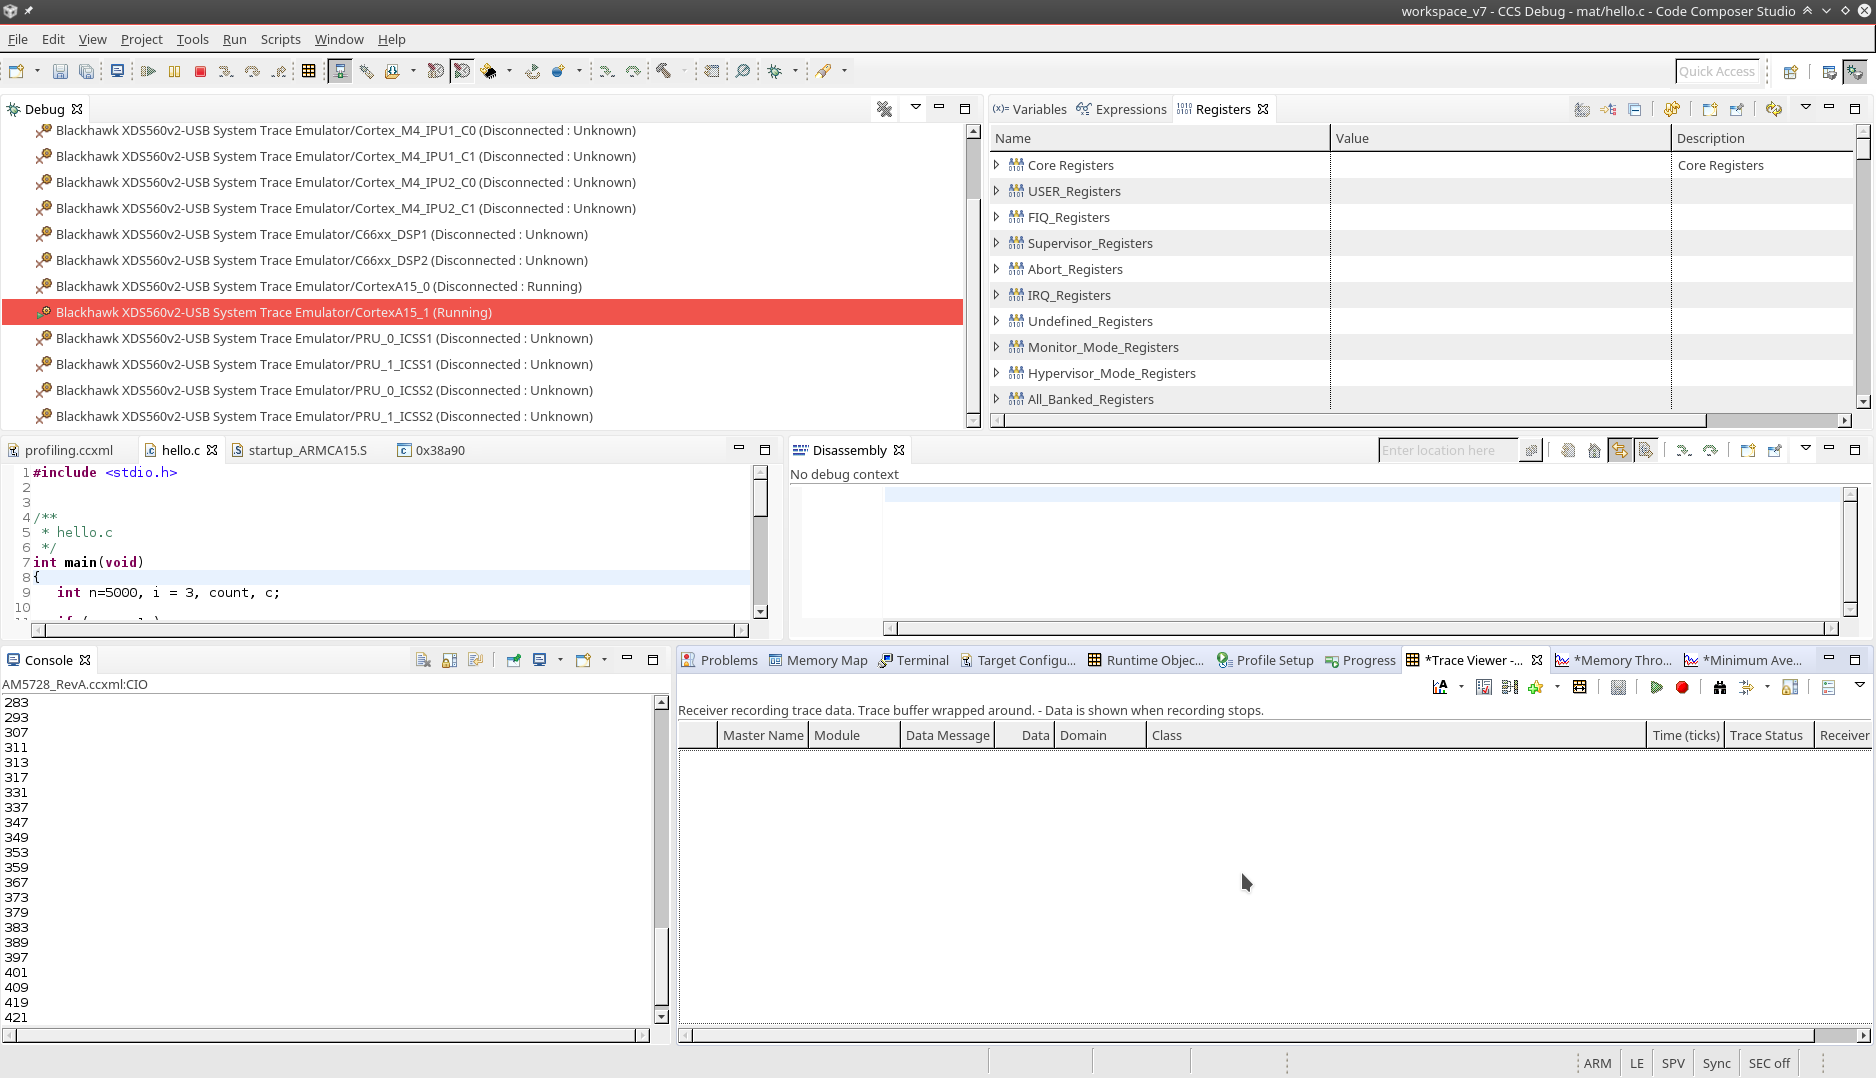
1) It uses on board ETB. But even for small programs, the trace buffer wraps around. That means, I cannot collect any meaningful data for the entire run of the application. Is there anyway to extract the ETB data before it wraps around? I understand that I could use the pro trace. But, it is so expensive for me.
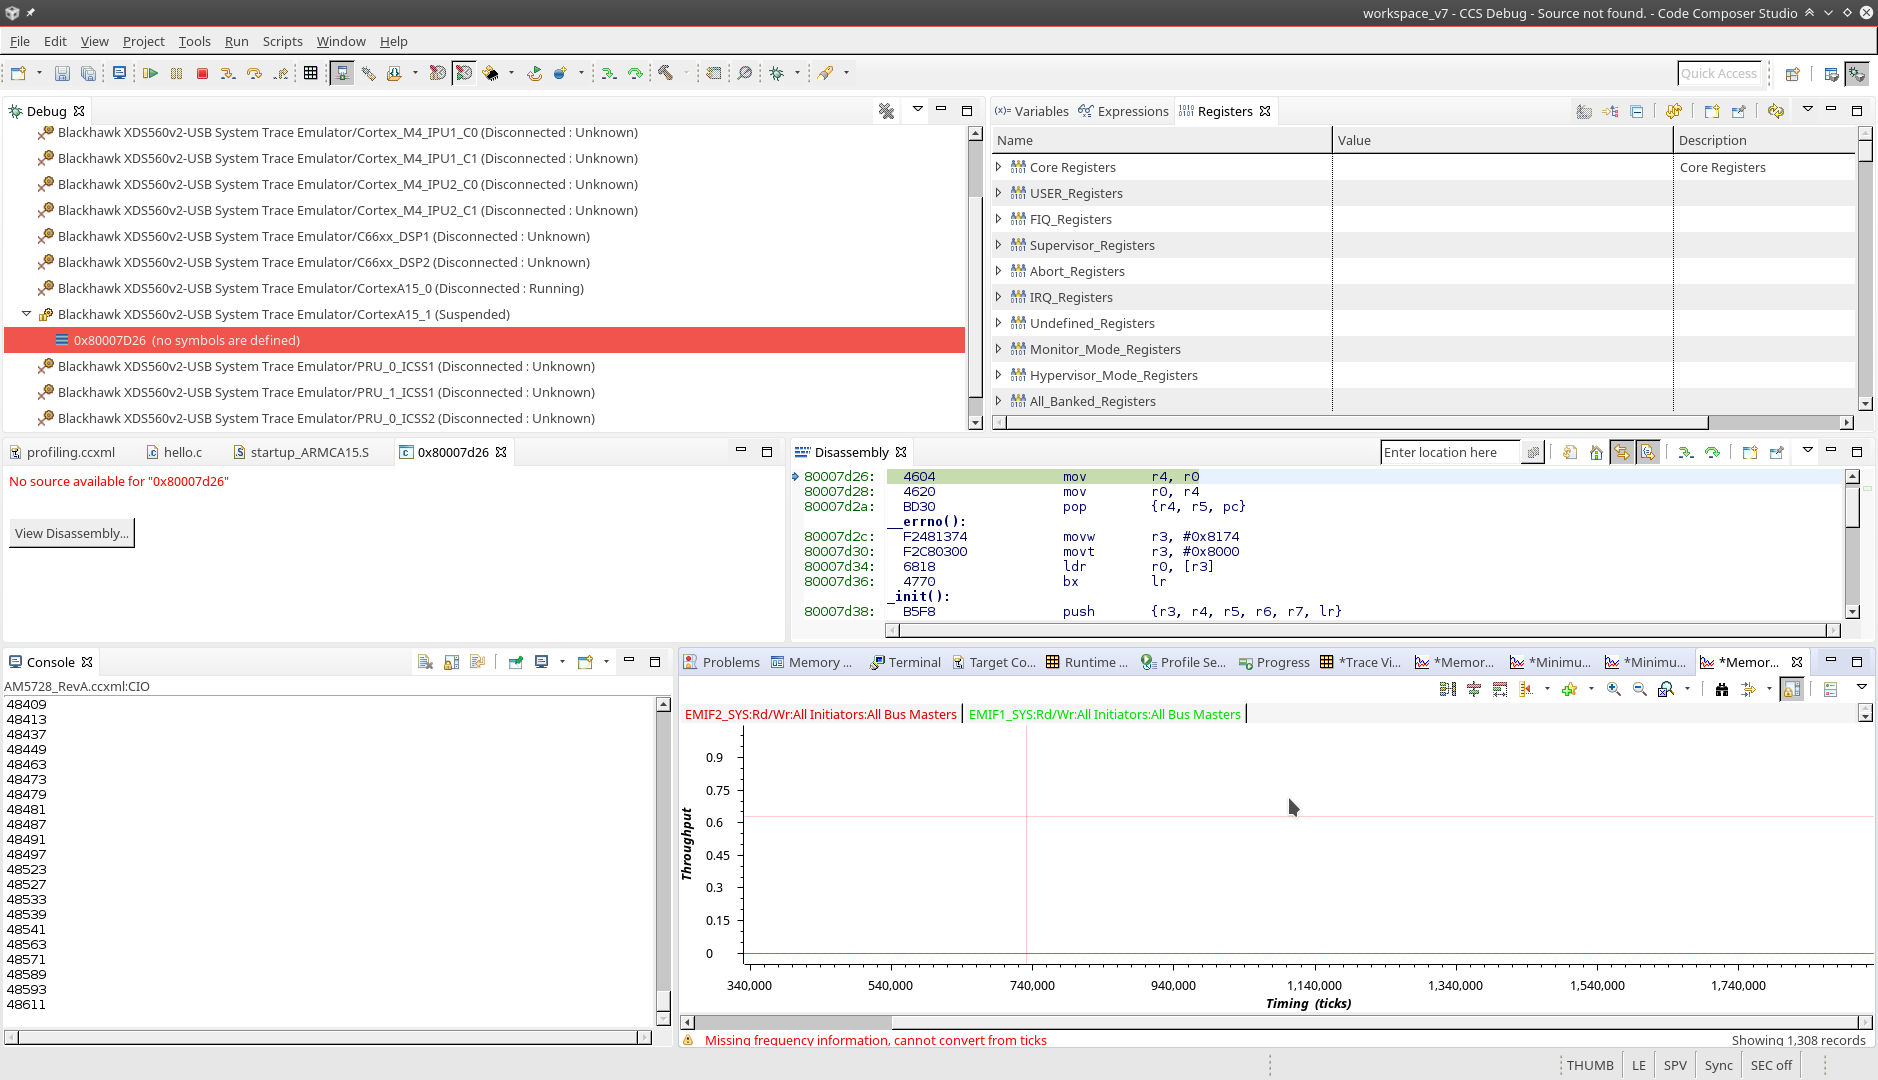
2) When, I am trying to run memory throughput analysis, I am getting "Missing frequency information, cannot convert from ticks" warning. See picture attached. It is only shown very briefly and then vanishes. Nothing relevant is shown. What could be wrong with that?
3) from PC trace > cache event profiler, I also see nothing. Is it supported for my debugger?
4) I also seem to get "Clock frequency not available. Cannot provide time in seconds" warning while doing PC trace. How do I correct that?
Thank you for your time.