This thread has been locked.

If you have a related question, please click the "Ask a related question" button in the top right corner. The newly created question will be automatically linked to this question.

CCS/66AK2G02: Debug step in , step over and back in ARM is opening assembly code.

Part Number: 66AK2G02

Tool/software: Code Composer Studio

Hi,

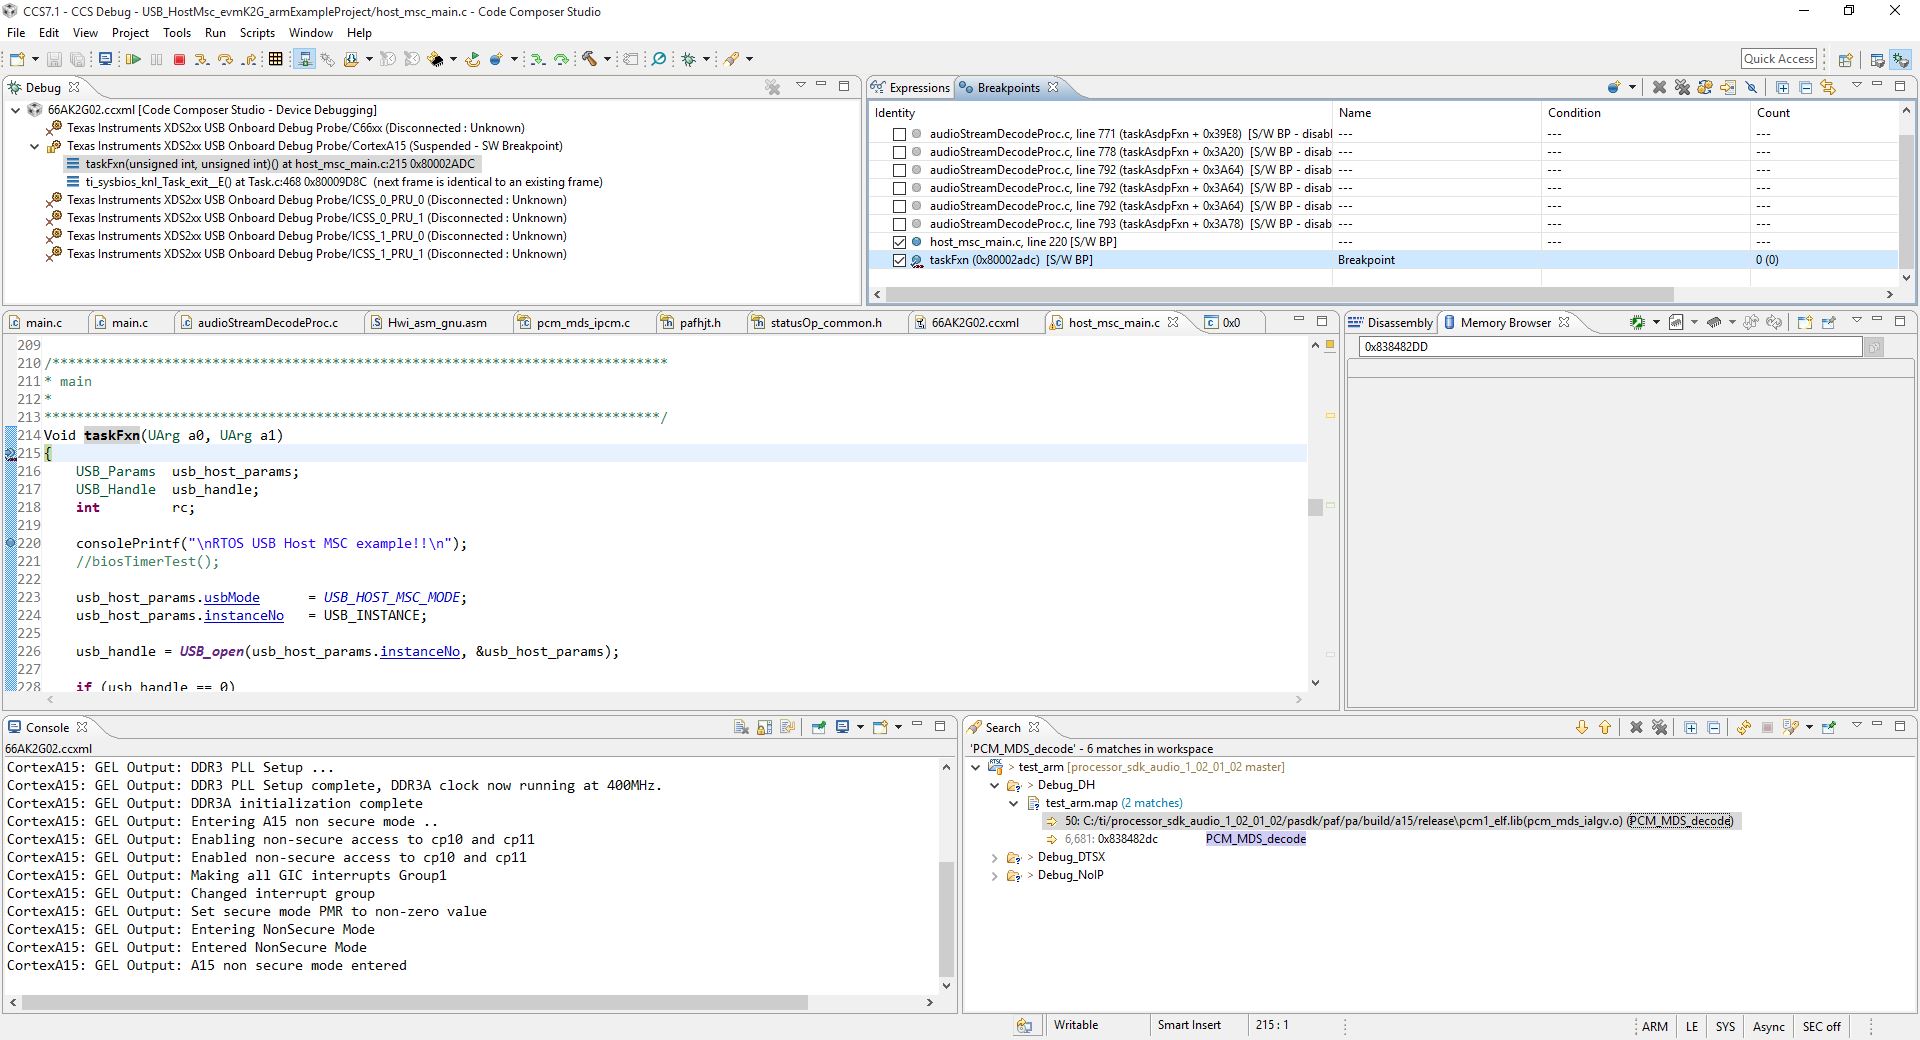
I am debugging some code in ARM processor, But when I does a step in  or  step over, it is showing assembly code. Every time this is happening. When I does a step back, it is coming back to source code, But again with a next step in\over it is going to assembly code. I want to debug through the C source code. How could I get this ?. I don't want to step through assembly code.

  • Hello,
    There are many potential reasons for the behavior you are seeing and it is difficult to pinpoint which one it is without more details. It could be that there is no source code correlation for that section of code that you stepping into. When you see just the assembly, does the editor have a message about not finding the source file? A screenshot of your whole CCS IDE would be helpful.

    Thanks
    ki
  • Hi Ki,

    I could see a message that, no source code is available for that particular address. 

    I am attaching the screen shots.

    1 . Breakpoint hit

    2. Pressed F6

    3. Again Pressed F6

    Here if I press F7, It will take me back to the same position in code. If I step over or step in , again the same will happen. If I keep on pressing F6, it will step through the assembly code.

    One thing, From the memory view, I have found the function name. And I found the source code for that function. Is it possible to explicitly load the source code? So that I could debug through the code.

  • Saseendranath sasi said:
    no source code is available for that particular address. 

    This means that there is no source code correlation found in the debug symbols for that address. 

    Saseendranath sasi said:
    From the memory view, I have found the function name. And I found the source code for that function. Is it possible to explicitly load the source code? So that I could debug through the code.

    If there is no source code correlation, then the debugger will not be able to do any source stepping. 

    You can use the Modules view to see what source code correlation does exist in the loaded symbols:

    http://dev.ti.com/tirex/#/?link=Development%20Tools%2FIntegrated%20Development%20Environments%2FCode%20Composer%20Studio%2FDebug%2FDocuments%2FFeature%20Overviews%2FBrowse%20loaded%20debug%20symbols%20with%20the%20Modules%20view%20(YouTube)

    What level optimization did you compile your code with?

    Thanks

    ki

  • Saseendranath sasi said:
    If I keep on pressing F6, it will step through the assembly code.

    From the screenshot the assembler code is the SYS/BIOS Hwi interrupt handler.

    I think the project properties in your project may have the "Disable Interrupts when assembly stepping" and "Disable Interrupts when source stepping" cleared. See the Debug Properties -> Program/Memory Load Options section of the CCS Debug Handbook for where to find those options.

    Note that the 66AK2G02 is a multi-core device so that when changing the CCS Debug Properties the "CortexA15" core in the Debug combo-box on the Debug Properties when making changes.

  • Hi,

    I have added the source directory path, and it resolved the issue. In debug configurations, Under Source -> CortexA15 -> I added the source directory. Then it worked. Thanks all, for your help