This thread has been locked.

If you have a related question, please click the "Ask a related question" button in the top right corner. The newly created question will be automatically linked to this question.

CCS/LAUNCHXL2-RM57L: Enable Profiling

Part Number: LAUNCHXL2-RM57L


Tool/software: Code Composer Studio

I'm trying to find out which part of my Code is running slow and for that I'd like to use the profiling feature of the CCS v7 but I can't activate it.

I followed the only guide I could find which is for an older Version and the list of supported devices there is empty.

When I try to activate the "Profile all Functions for CPU Cycles" I only get "Unable to enable activity". A not quite useful error message.

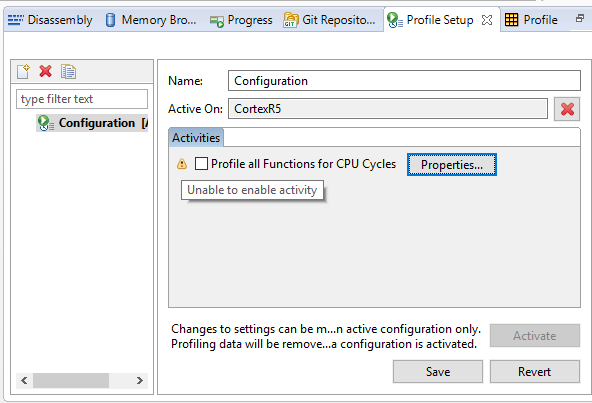
So my question is whether I'm missing something or is profiling not supported on my device?

Also if it's not supported in CCS7 is it supported in CCS8?

Thanks in advance

Michael

  • Michael,

    The Profiler is an older tool that requires setting a series of breakpoints all around your code to measure performance per function. It was perfectly suited and designed to run on the (now deprecated) simulators, but it can also run on devices that run code in RAM memory with limitations (breakpoints can disrupt real-time operation, especially interrupts). Non-volatile memory requires HW breakpoints, which are limited to a few - I can't recall how many on the Cortex R platform, but that is usually restricted to four or six.

    For hardware you have a few options: the Profile Clock, which is a point-by-point time measurement system, and a complete Trace system, which can perform ETM Trace on Hercules platforms.

    Profile clock: processors.wiki.ti.com/.../Profile_clock_in_CCS
    Trace Bundle: store.ti.com/rm57l-protrace.aspx

    Hope this helps,
    Rafael