This thread has been locked.

If you have a related question, please click the "Ask a related question" button in the top right corner. The newly created question will be automatically linked to this question.

CCS/66AK2H12: ROV Classic : Task->Detail question

Part Number: 66AK2H12

Tool/software: Code Composer Studio

XDCtools 3.32, SYS/BIOS 6.46, CCS 7.4, PDK 4.0.7, NDK 2.25

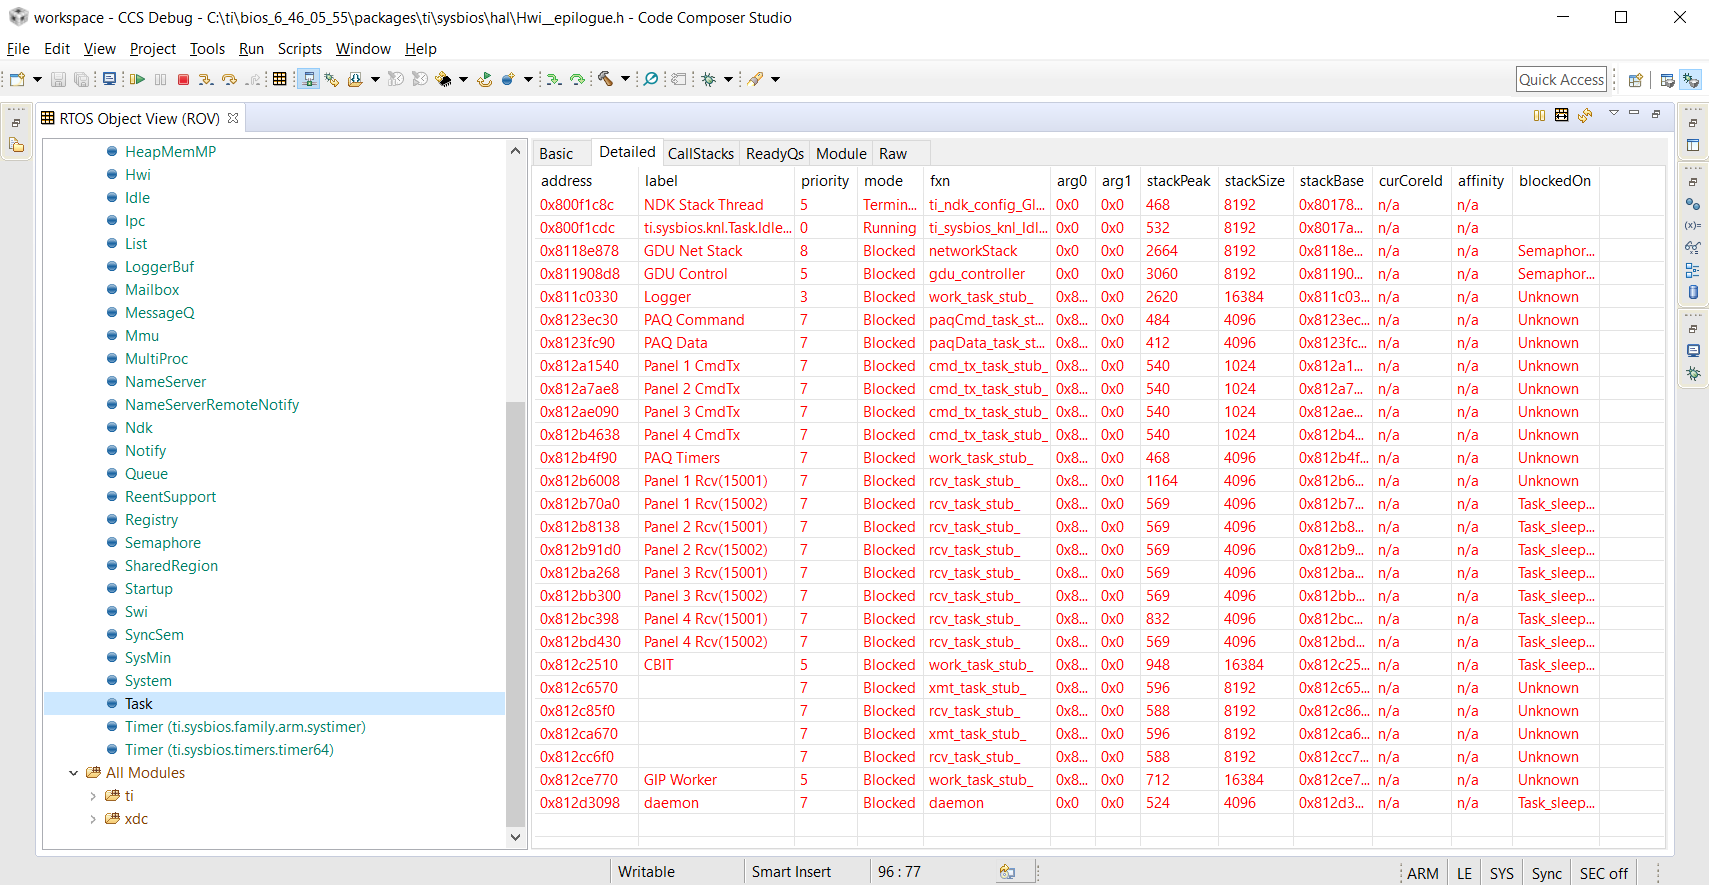
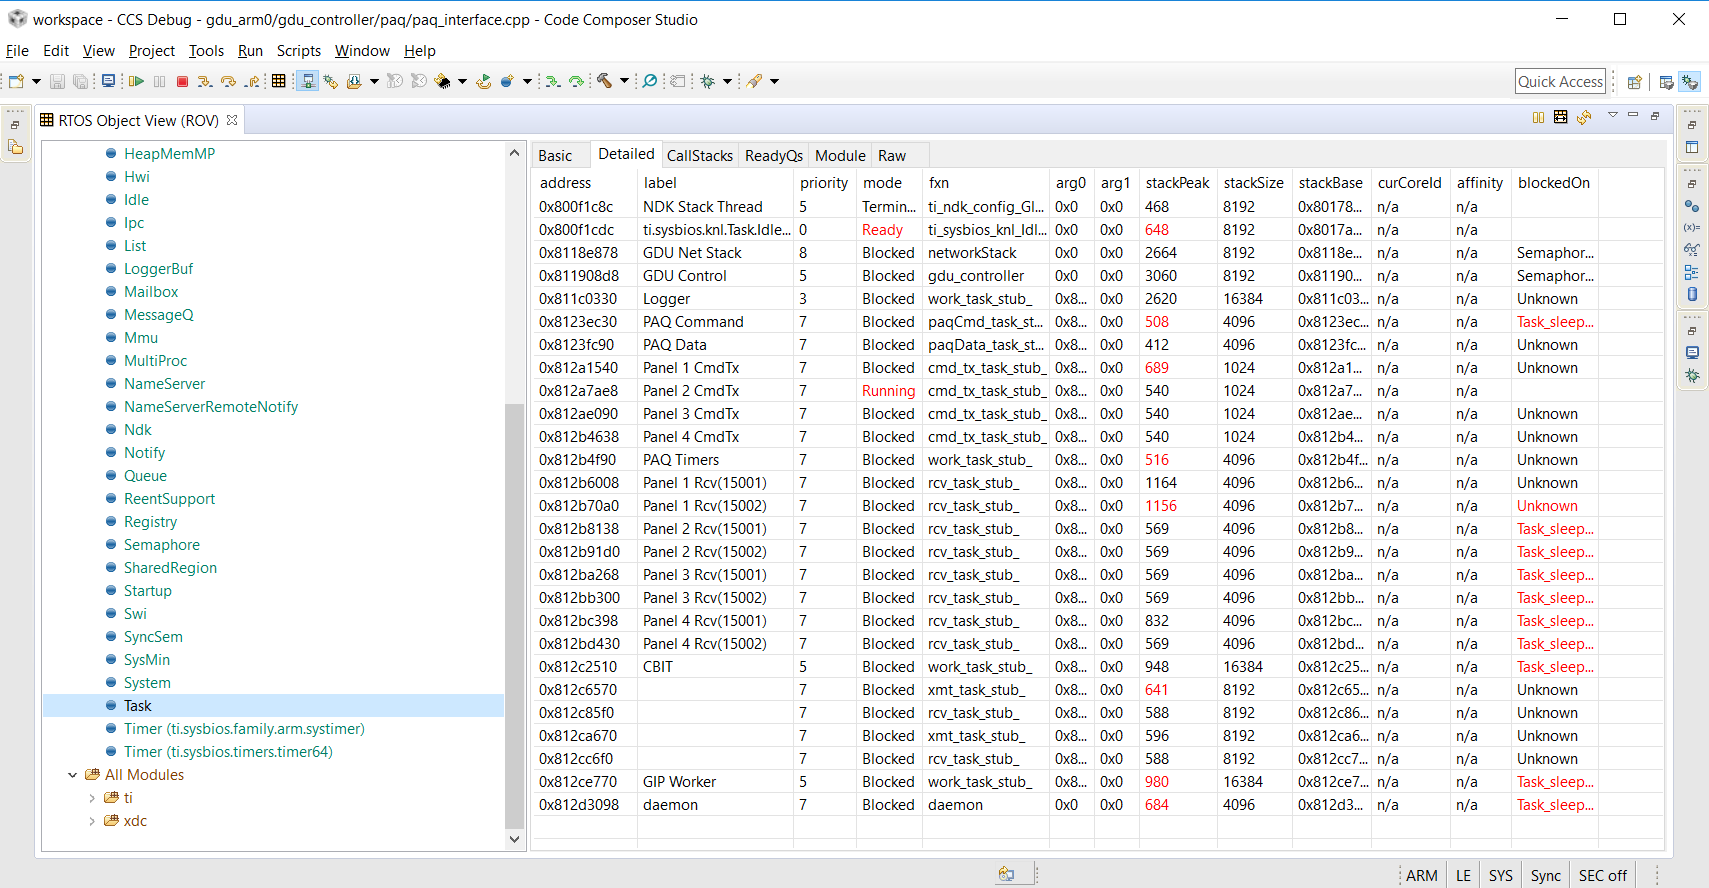
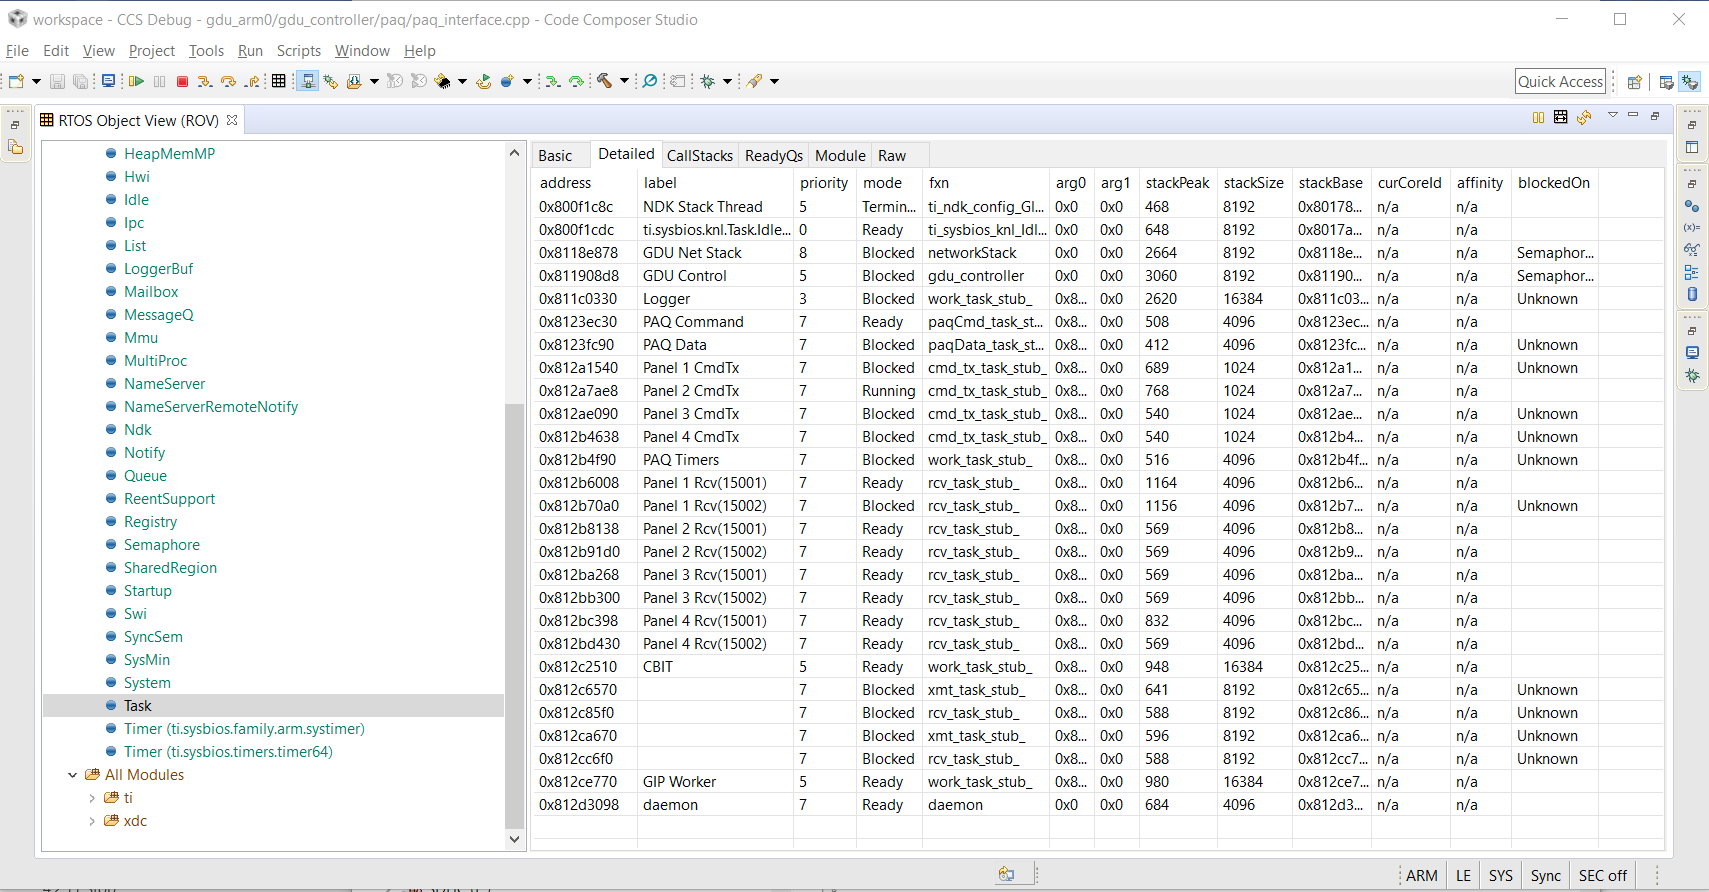
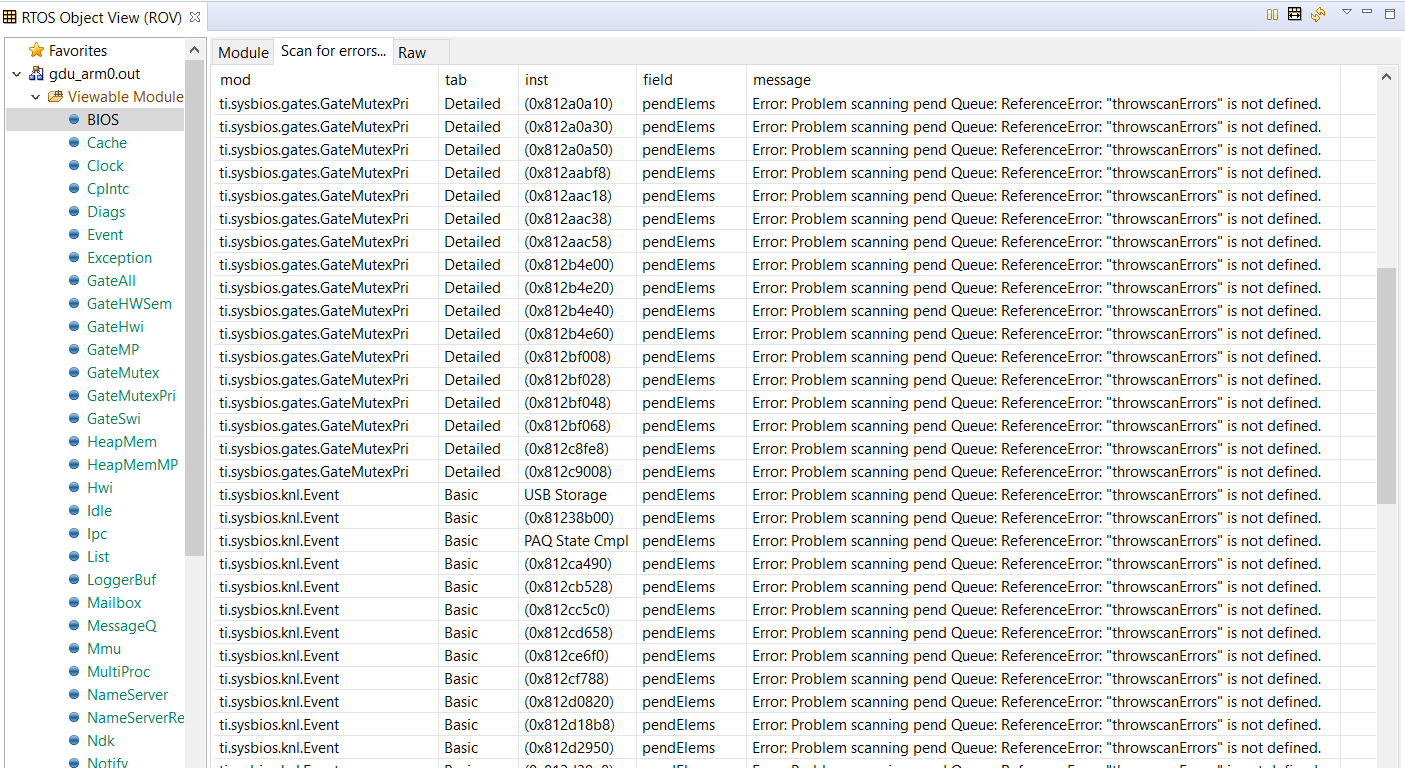
When I view the Detailed tab of the ROV Task very often all data is display in red. What is that telling me? I know in other views, and at other times in Task->Detailed only items that have changed are in shown in Red. When I see everything as red I'm not sure how to interpreted it. It is giving me a bad feeling. 

Mike

  • Mike,

    As you mentioned, the data that changes is presented in Red. Is there any particular reason you feel this isn't right for the Task view?

    Could you attach two screen captures of the Task view while your program runs and halts, so I can see more accurately what may be happening?

    Also, what project are you using? I can try to reproduce here if it is one of the example projects.

    Regards,
    Rafael
  • Hello Rafael.

    It is in my project that I see the all red at times. I haven't tried an example. I'm attaching several captures taken at various points.

    Above: While running - boring as nothing is shown..

    After letting the project run, I hit the Suspend button and captured the above. Application is running. All my tasks have been created.

    Above I've hit a break point. I guess the above is what I was expecting to see most of the time. A handful of specific things displayed in red indicating change.

    Above I single stepped. Now a lot of the info is blank, specifically the blockedOn that was shown before single stepping.


    Now I let it run again to the same break point. Below is the next capture I get when I hit the break point again:

    The above looks 'not good'. It is this that I am looking for an explanation of.

    Mike

  • Any opinion on the screen captures in my prior posting? Does this appear to be a problem or is this normal?
  • Mike,

    Please apologize for the delay; yes, you are correct: it seems that unchanged entries are, in fact, being highlighted in red.

    One question: do you know if the device ended up resetting itself between breakpoints? If the ROV detects that condition, that could explain why it would highlight everything in red again. An inadvertent reset would show at the Debug view, right after the core in use with the message "Running - A Reset has occurred on the target".

    Apart from that, I can't explain what may be going on. I can try to reproduce this here, but do you know if this happens in an example code or only in your custom code?

    Regards,
    Rafael
  • Hi Rafael, thanks for taking a look at this.
    I am certain the EVM is not resetting between breakpoints. I do not recall seeing this in the various example codes I looked at but than again I wasn't paying attention to this at the time I was working with examples. I can revisit when I get a chance. My general recollection is that I had not been seeing this in my projects until 'recently'. But I generally haven't been looking at this until recently when I've been trying to solve some network related issues. My worry is that this is an indication that 'something bad' is going on; corrupted memory or something. But I don't know if that is true or not and if so, where to start looking to solve it.
  • Mike,

    I am trying to run a few of the PDK examples here but so far I couldn't see the issue; to me the only entries in RED are changed within expectations.

    I will keep trying other examples and see if I can get different outcomes.

    Regards,
    Rafael
  • Mike,

    Are you still having this issue? I see a few additional threads that seem to indicate you are past this but I would like to confirm.

    I have been running some other examples and demos here in my setup but I really wasn't able to reproduce this issue unless something catastrophic happens (reset, lockup, etc.), but by then the entire information seems corrupt and not well formed like yours.

    Unfortunately I am at a loss at what may be happening in your system and I am out of ideas.

    Regards,
    Rafael
  • Yes I still have the issue. I wish I knew what it meant. It doesn't appear to be causing any side effects nor do I detect any problems in operation. I haven't gotten any other hints to feed you, it is all red about 30% of the time. It must mean something and the fact that it is all RED give me the feeling that whatever it means, it can't be good.

  • Mike,

    The TI-RTOS experts suspect it may be a bug with the ROV Classic viewer and suggested you to go to the option BIOS and select the tab "Scan for errors". That should give an extra level of confidence that your system is working as it is supposed to do. I am using CCSv8.0.0, which may also contribute to that.

    Unfortunately the ROV Classic is not being maintained anymore, thus the TI-RTOS team suggested using the Runtime Object Viewer option (which is the newer version). However, I wasn't able to make it work properly in CCSv8.0.0 but only on the yet unreleased 8.1.0 (it is probably a combination of the RTSC and the GUI components).

    Regards,
    Rafael
  • Rafael,

    Thanks for the additional information. Unfortunitely we've never been able to get the new ROV working although I just tried it again and it seemed to get further along than I remember from the last time I tried it back last early Fall:

    In regard to the "Scan for errors", maybe you have found a clue. Where can I find documentation on "Scan for errors" to learn what it does for me? I ran it and it is showing many errors but I do not know what they mean:

    All the tasks were displayed in RED when I went to the above tab.

    If I suspend and step until I am not getting all tasks in RED , then the Scan gives:

    I am using GateMutexPri throughout my code.

    Mike

  • Mike,

    The error you found in the "Scan for errors" is an existing bug in the xdc tools used by your project.

    To fix this:

    - Open the file C:\ti\xdctools_3_32_02_25_core\packages\xdc\rov\Program.xs

    - at line 645, fix the invalid object name.

    Where it reads:

           if (throwscanErrors) {

    change to

           if (throwScanErrors) {

    Save the file and re-run the Scan for Errors. It should display the exact error explanations.

    Also, I got a confirmation that ROV2 works in the newest release of XDC tools 3.50.6.19 available for download at:

    http://software-dl.ti.com/dsps/dsps_public_sw/sdo_sb/targetcontent/rtsc/3_50_06_19/index_FDS.html 

    Given that you are using other tools that depend on the older XDC, I suspect you will have to wait until CCSv8.1.0 is released if you are willing to use the new ROV with the existing project.

    Hope this helps,

    Rafael

  • What error did I find? Are you saying the varying results when I do a scan for error is the problem it self or the data reported is the error? Is the bug related to the RED display under Tasks? I ask because there seemed to be a distinct correlation between Scan for Errors listing error and all RED in tasks. If Scan for Errors reported none, than tasks were not all in RED. At least for the few iterations I tested.

    I will make the change you suggested and give it a try.

    I'd reluctant to change XDC tools. Our project is quickly falling behind schedule. We need a new NIMU driver badly. We fought tool sets at the beginning of the project last late summer and it was quite difficult. Often the E2E responses were to use the latest, other times a specific tool, other time 'use the set that came with the EVM CD'. We have a set now that all works and unless there is a really compelling reason to change I think our s/w team would be hard to convince to move.

  • (sorry for the delay; the forum ate the reply I wrote yesterday)

    Mike,

    Mike Dannhardt said:
    What error did I find

    The data reported. The error I mentioned is shown in the message tab of the "Scan for errors" results, and the giveaway is the text "ReferenceError: "throwscanErrors" is not defined". 

    This will only repair the problem with this report, but the original problem with your system persists. 

    Mike Dannhardt said:
    I'd reluctant to change XDC tools.

    At your development stage, I would be reluctant as well. Let's hope the error reporting gives additional insights about the system problem and we move from there. 

    Hope this helps,

    Rafael

    P.S. I accidentally clicked on the 'TI thinks answered' button in my previous reply. I apologize. 

  • Mike,

    The lack of further information makes me believe the workaround helped you move forward with this issue. I will mark this as closed but please feel free to report back if you still have problems, ok?

    Thank you,
    Rafael