This thread has been locked.

If you have a related question, please click the "Ask a related question" button in the top right corner. The newly created question will be automatically linked to this question.

CCS/TDA2P-ACD: Debugging GCC output for Cortex M4 using Code Composer

Part Number: TDA2P-ACD


Tool/software: Code Composer Studio

We are building bare metal software for the TDA2P using the GNU Arm Embedded Toolchain (developer.arm.com/.../gnu-rm) and custom makefiles.
To debug the code we want to use CCS 8.0.0.16 and an XDS560v2 debugger. Connecting to the target and uploading the ELF is working fine and the debugger stops at the entry point of the main function.
We are using a project-less debug session, so I have to manually locate the file containing the main fucntion.

The problem is that setting breakpoints only works for the file where the main function is included. I can use 'Step Into' to step into functions from other source files without problems.
The file is found and stepping through the code is working fine, but setting breakpoints does not work as expected. Every breakpoint is greyed-out imediatelly, i.e. set to inactive. If I try to activate the breakpoint I get the following message:
"No code is associated with "FILENAME", line XXX in any loaded symbols."

This is my code:

line 186:   McSPIChannelDisable(              <- I set a breakpoint here
line 187:      u32_base_addr,
line 188:      u32_channel);

In the Disassembly window I see the following:


186          McSPIChannelDisable(                            <- Inactive breakpoint is set at this line
9e004f80:   68B9                ldr        r1, [r7, #8]
9e004f82:   69B8                ldr        r0, [r7, #0x18]
9e004f84:   F000FD26            bl         #0x9e0059d4

When I try setting a breakpoint in the disassembly view at address 9e004f80 (the line folowing the function call) I can see an active breakpoint at the exact same source code line (186) where I previously tried to set a breakpoint. But working that way is not an option as it is very time consuming.

These are our compiler and linker calls (includes and object file names have been removed for readability).

arm-none-eabi-gcc.exe -mthumb -std=gnu99 -fno-short-enums -g3 -MD -MP -DSOC_TDA2PX -D__TI_ARM_V7M4__ -mcpu=cortex-m4 -march=armv7e-m -c -o spi.o spi.c

arm-none-eabi-gcc.exe -specs=rdimon.specs -T linker/linker_ipu1.lds -static -fno-short-enums -mcpu=cortex-m4 -march=armv7e-m <all objects> libs/ti.csl.aem4 libs/csl_uart_console.aem4 -lrdimon -lc -lm -o elf/out.elf

  • Hello Sascha,
    I have heard of a similar issue when debugging GCC executables in a project-less debug session. It looks like some issue with the source code correlation with the debugger. It could be a bug in the DWARF symbols, or it could be a bug in our object file parser. We've never been able to properly investigate the issue because we've never been able to reproduce the issue locally. What would really be helpful is if you could provide a small generic test case (source files and executable), the simpler the better. All the test case needs to do is to reproduce the issue where setting a breakpoint in the source file does not work while setting it in the disassembly view does work (and it will then associate the breakpoint in the same source file that did not work previously).

    Thanks
    ki
  • Hello Ki,

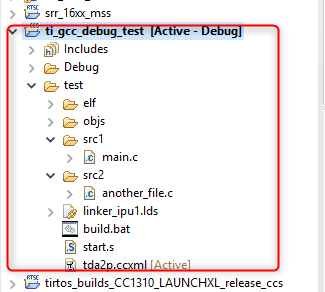
    I created a small example project including two C and one Assembler file. I also included the ELF output and all object files. To build it you just need to run the build.bat file. I used the included tda2p.ccxml file to connect to the target using a project-less approach and also after importing the code as a makefile project in CCS.

    This is what I did:

    • Lauch Target Configuration
    • Connect to CortexA15_0
    • Start the GEL file under scripts -> TDA2Px MULTICORE Initialization -> IPU1SSClkEnable_API
    • Connect to Cortex_M4_IPU1_C0
    • Load Program
    • Locate the file for main.c in the src1 directory
    • Set a breakpoint in line 10 (function call)
    • Resume, then Step Into which brings me to "another_file.c"
    • Trying to set a breakpoint in line 4 (at c = a + b) does not work (for me it doesn't even show as an inactive breakpoint in the code view but it appears in the Breakpoints view)
    • Setting a breakpoint at address 9e00014a in the disassembly view sets the breakpoint in line 4 of the code

    I used a Windows 10 Pro machine to build the software. This is the CCS version info

    Code Composer Studio
    Version: 8.0.0.00016

    OS: Windows 10, v.10.0, x86 / win32

    ti_gcc_debug_test.zip

  • Thank you for the excellent test case. I can reproduce the issue. There is certainly some source code correlation issue. I will file a bug for this and also find a workaround.

    Thanks
    ki
  • A bug was filed for this issue. Tracking ID: CCSIDE-3359

    There is one workaround that has been validated so far. Create a dummy project that contains the source files.

    Then reference the project in the debug launch configuration:

    Note that when specifying the source look up path, make sure you have the right CPU selected in the "Device" field for multi-core targets.

    It is a clunky workaround but does the trick. If I find something better, I will let you know.

    Thanks

    ki

  • Ki-Soo Lee said:
    It is a clunky workaround but does the trick.

    With CCS 8.0.0.00016 have a Cortex-A8 project using the gcc-arm-none-eabi-7-2017-q4 compiler. CMake generated makefiles are used for the build, and a "makefile project with existing code" Eclipse project was created to allow CCS to browse, edit and debug the project.

    Taking the C source file with the main and trying different methods of using breakpoints:

    1) With the debug configuration set to auto-run to main, on starting a debug session successfully halts at main.

    2) If double-click on a source line get an Eclipse breakpoint (small blue circle) and the debugger doesn't halt at the breakpoint. Modifying the source look up path to add the specific directory containing the source file didn't change the behaviour.

    3) If select a source line and use "Run to Line" the program halts at the selected source line.

    4) If right-click on a source line and select "Breakpoint (Code Composer Studio) -> Breakpoint", then get a Code Composer Studio breakpoint (a large blue circle with a tick) and the program halts at the breakpoint.

    Therefore, creating a dummy project to contain the source files doesn't appear to a completely reliable work-around. Does the difference in behaviour between tests 2 and 4 give a clue about the cause of the problem?

  • Hi Chester,

    The issue is that a standard Eclipse project was used instead of a CCS project. When a CCS project is associated with a debug session, the debugger will always default to a CCS breakpoint. If an Eclipse project is associated with a debug session, the debugger will default to an Eclipse breakpoint. If you wish to have the debugger default to a CCS breakpoint instead, you can go to the project properties of the Eclipse project and enable the option to default to CCS breakpoints:

    Thanks

    ki

  • Ki-Soo Lee said:
    The issue is that a standard Eclipse project was used instead of a CCS project.

    Thanks, I didn't know about the option to Enable Code Composer Breakpoints Support when using a standard Eclipse project.

    Confirm that addresses my issue.

  • Thanks for your fast response. We verified the workaround on two PCs and is working.