This thread has been locked.

If you have a related question, please click the "Ask a related question" button in the top right corner. The newly created question will be automatically linked to this question.

CCS/CC1310: How to debug a running CC13xx without halting it

Part Number: CC1310

Tool/software: Code Composer Studio

Hi, 

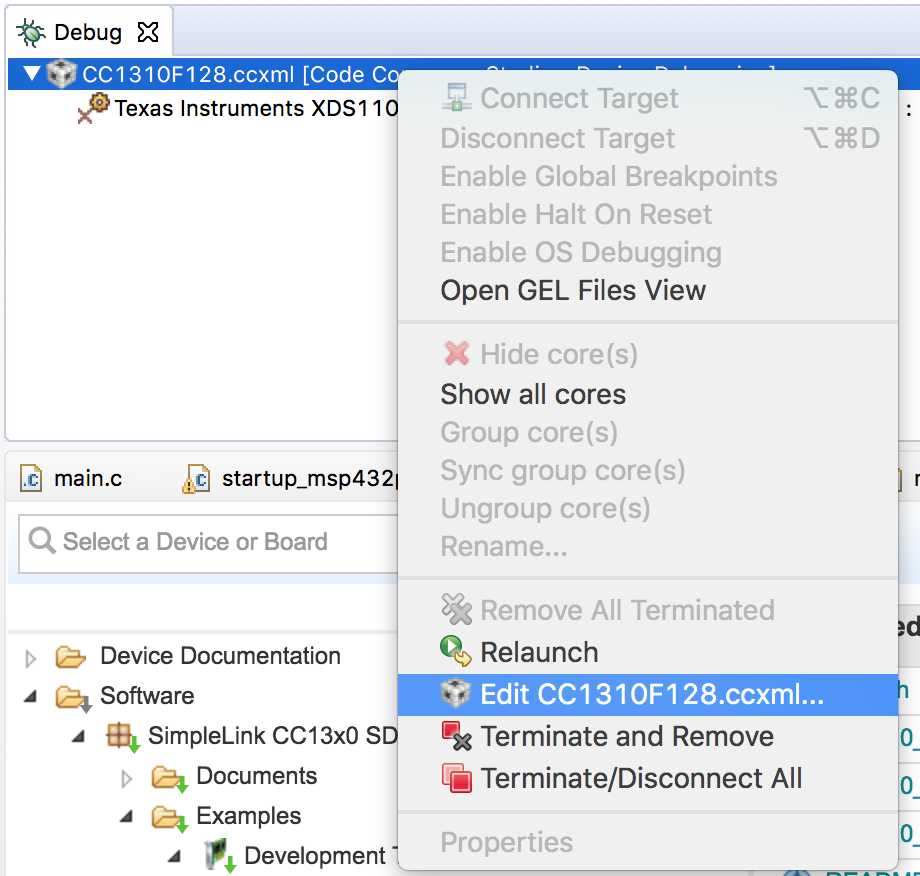
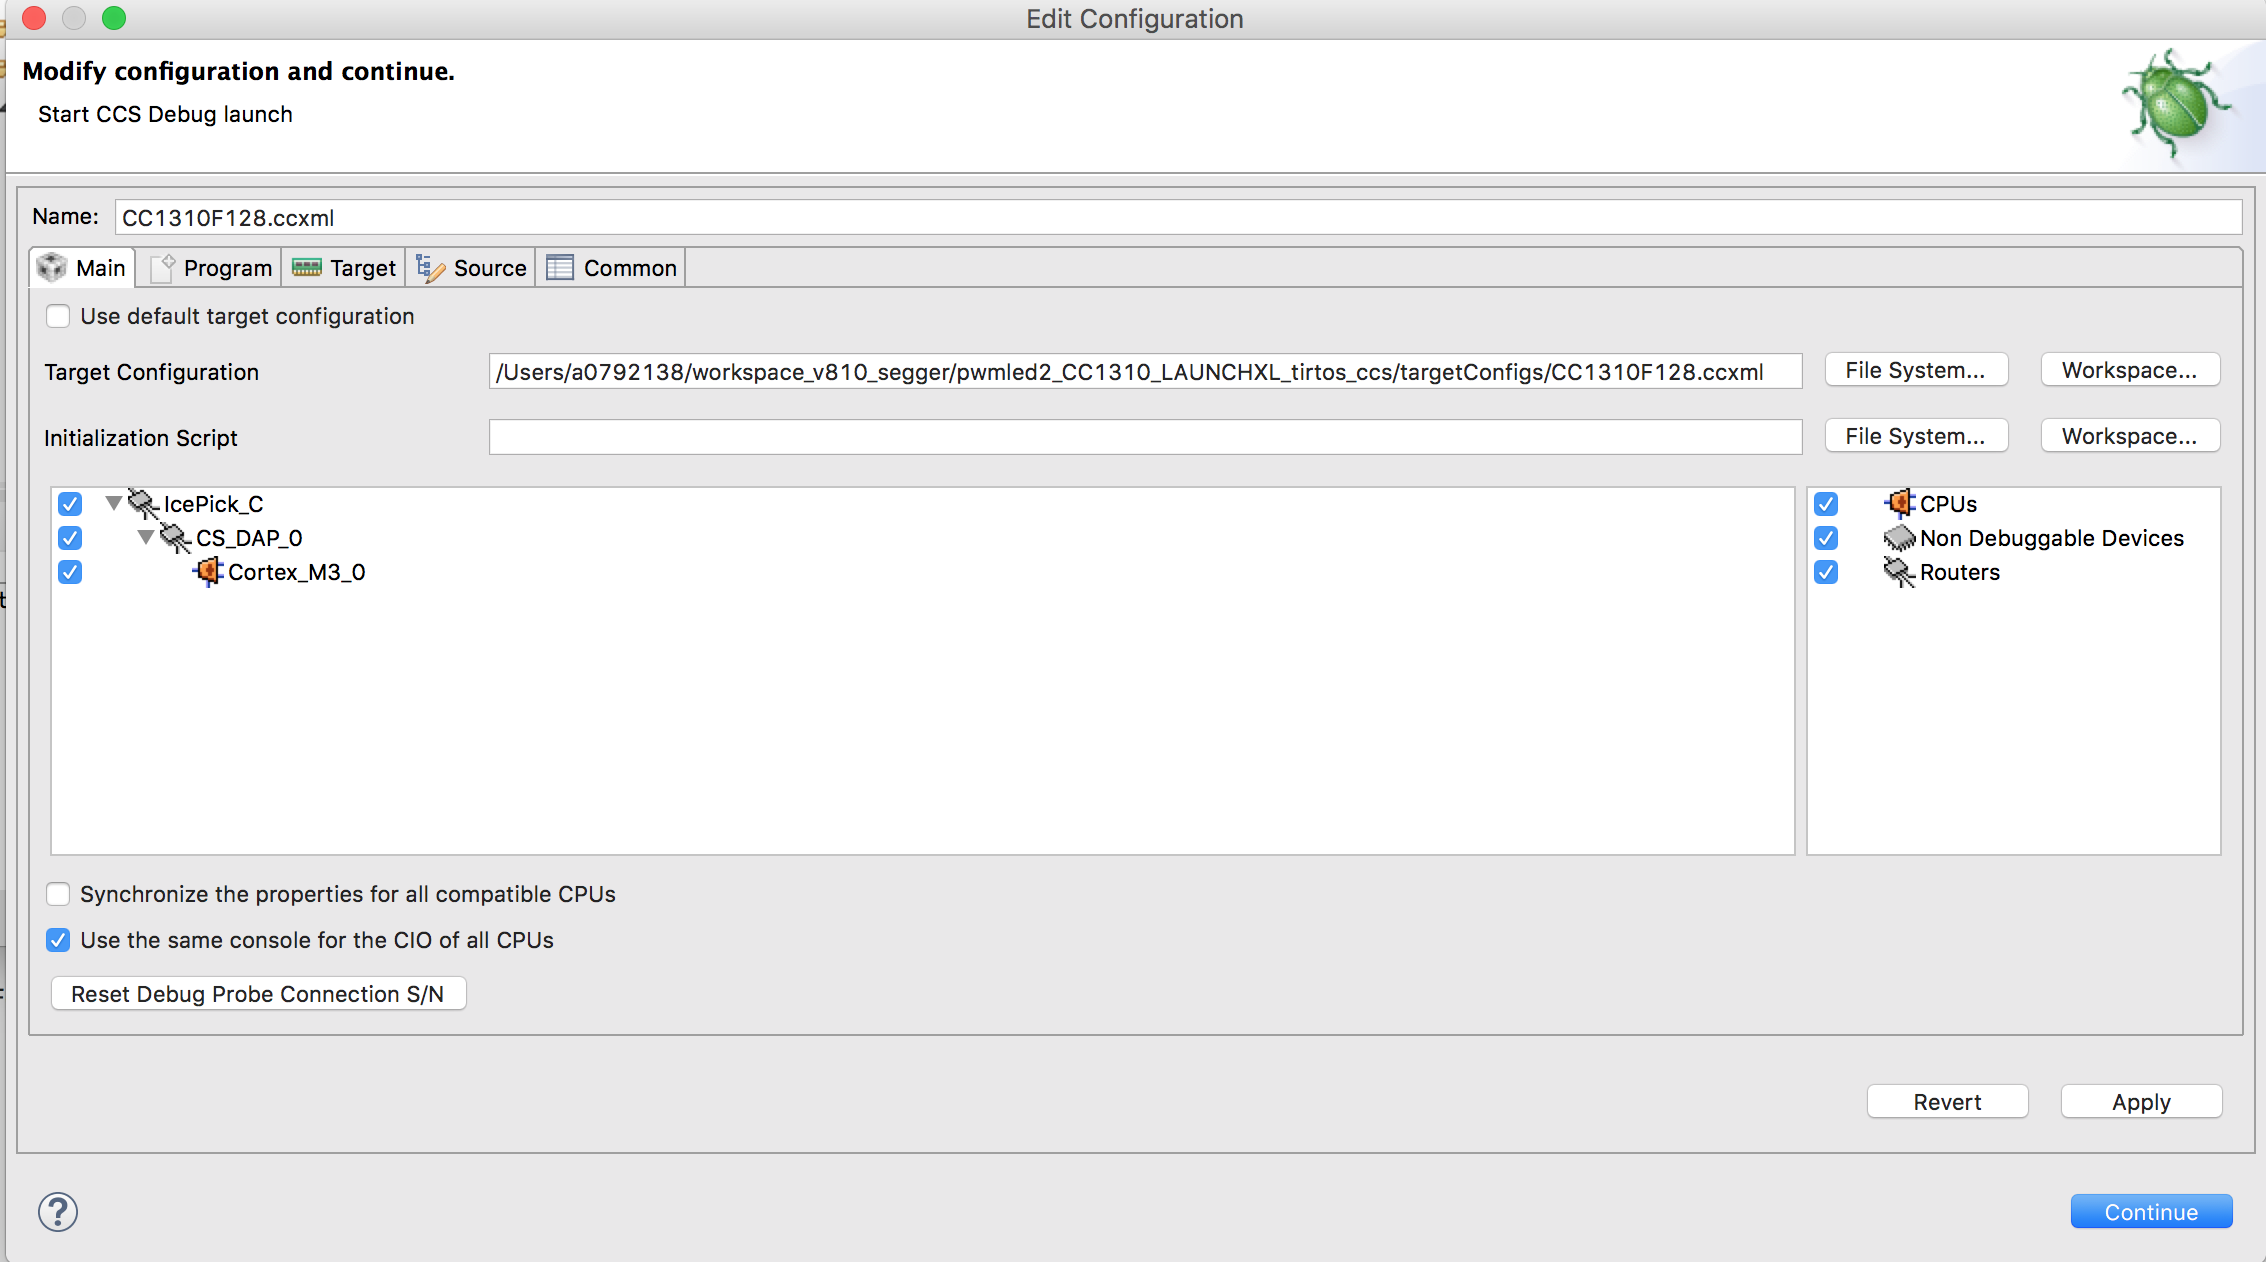
I am using ccs v7.4 to develop my cc13xx project. Recently I have trouble in debugging a running target without halting it. In fact I've read the related threads in the forum but they don't seem to work in my CCS.

Here are my debug configurations:

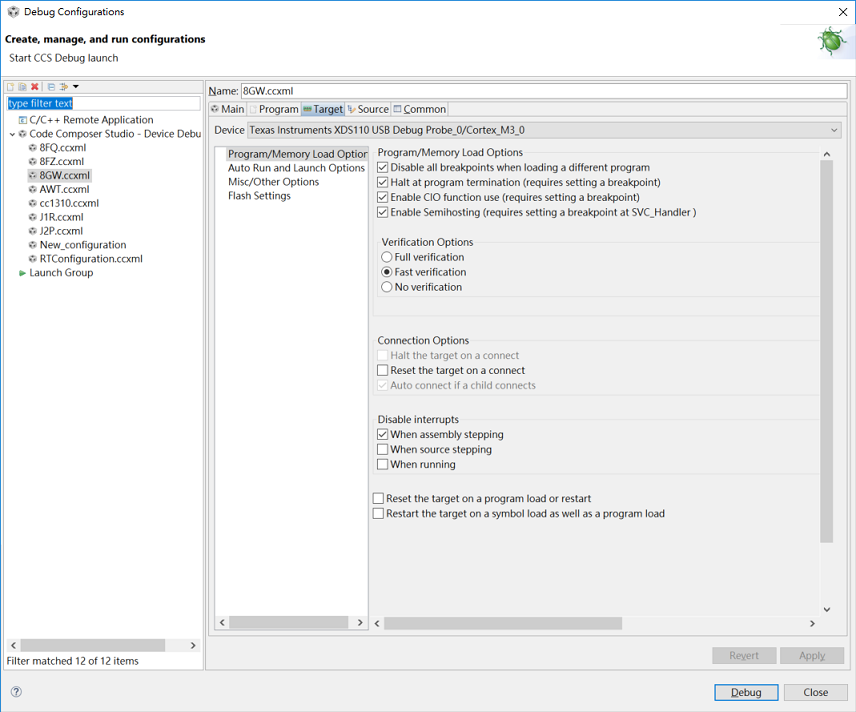
Any suggestion is welcome. 

Matt

  • Matt,

    It really looks like it is hard coded to halt on debugger connect. I will need to talk to some device experts but thus far I have not been able to prevent it from halting.

    Regards,
    John
  • Unfortunately that halt is always occurs when you connect the Cortex M on CC1310. There is no option to disable it. The only option you would have for debug without halting would be to connect to just the DAP and then you would be able to read out memory without halting. If that is of interest I could show how to do that.

    Regards,
    John
  • Thanks, John.

    Sure. I like to know how DAP can work without halting. At least it's better than nothing..lol 

    By the way, is there any release plan in ccs to prevent halting?

    Thanks,

    Matt

  • Matt,

    There is an ongoing discussion on what it would take to connect to the cortex M without halting.  We do support that for other devices.

    Here is how to connect the DAP and do accesses without halting.  Warning that there are a few steps involved.

    First we have to create a copy of our Target Configuration file.

    In your project there is likely a targetConfigs folder with a file "CC1310F128.ccxml"

    Copy and paste that file in the folder and give the copy a new name.  Lets call it DAP_debug.ccxml

    Double click on this file to open it in the target configuration editor.

    Click on the advanced tab at the bottom.

    Select the "IcePick_C" item in the tree and then clear the field for the initialization script:

    Do the same for the CS_DAP_0 and Cortex_M3_0.  We have to do this as those scripts perform actions that halt the device.  We are doing it in a copy of the file so that you still have the original one for normal debugger as it ensures that it puts the device in a good state and you want to keep that for general use.

    Now we need to create a debug launch for this new file.

    Go to View -> Target configurations

    Location your target configuration file (ccxml).  Projects ->  <project name> / targetConfigs

    Right click on it and select "Launch selected configuration"

    This is going to launch the debugger and create what we call a debug launch that is associated with the ccxml file instead of the project

    In the debug view right click on the name of the ccxml and select the edit menu item (note that my name is different than yours as I did this capture before realizing I was going to have to create a copy of the file):

    By default the debug session will only show CPUs.  On the right hand side check the box to show non-debuggable devices and routers.  

    Click apply and continue.

    Click the red square to terminate the debug session.

    Go back to the target configuration view and launch again.

    Now we will see the DAP in the debug view:

    We can then connect to the DAP and use the memory browser to inspect memory while the target is running.

    Regards,

    John

  • Were you able to give this a try?
  • Hi, John:

    Sorry for my late reply. I did follow your steps and saw the CS_DAP but just could not connect to my target successfully. Here comes my ccs snapshots for your reference.

    Thanks,

    Matt 

  • Matt,

    Seems like the device is in a state that it cannot even access the IcePick (JTAG router on the chip). That is one of the purposes of those GEL files is to ensure that the device is in a good state. Unfortunately they disrupt execution to do so.

    Can we try with one of the example programs. I was running the pwmled example imported from Resource Explorer. If we can get that going then we can try getting your app going. Debug it once just with a normal debug launch sequence and then try the steps above to do a non-intrusive debug.

    Regards,
    John
  • Matt,

    Did you want to continue with this? I am out next week and if you want to keep giving this a try I can loop in someone or we can close the thread.

    Regards,
    John