This thread has been locked.

If you have a related question, please click the "Ask a related question" button in the top right corner. The newly created question will be automatically linked to this question.

CCS/TMDXIDK5718: Debugging U-Boot: HW-Breakpoint don't stop/ no sync to source

Part Number: TMDXIDK5718

Tool/software: Code Composer Studio

Hi

I'm using Code composer studio 8.0.0, connected to a IDK5718 via XDS200 USB-to-JTAG

I built Sitara RT Linux SDK V5.0.0.15 according to instructions in "Linux Board Porting Series, module 6".

Then I follow "Linux Board Porting Series - Module 7 - Debugging U-boot with JTAG in CCS". 

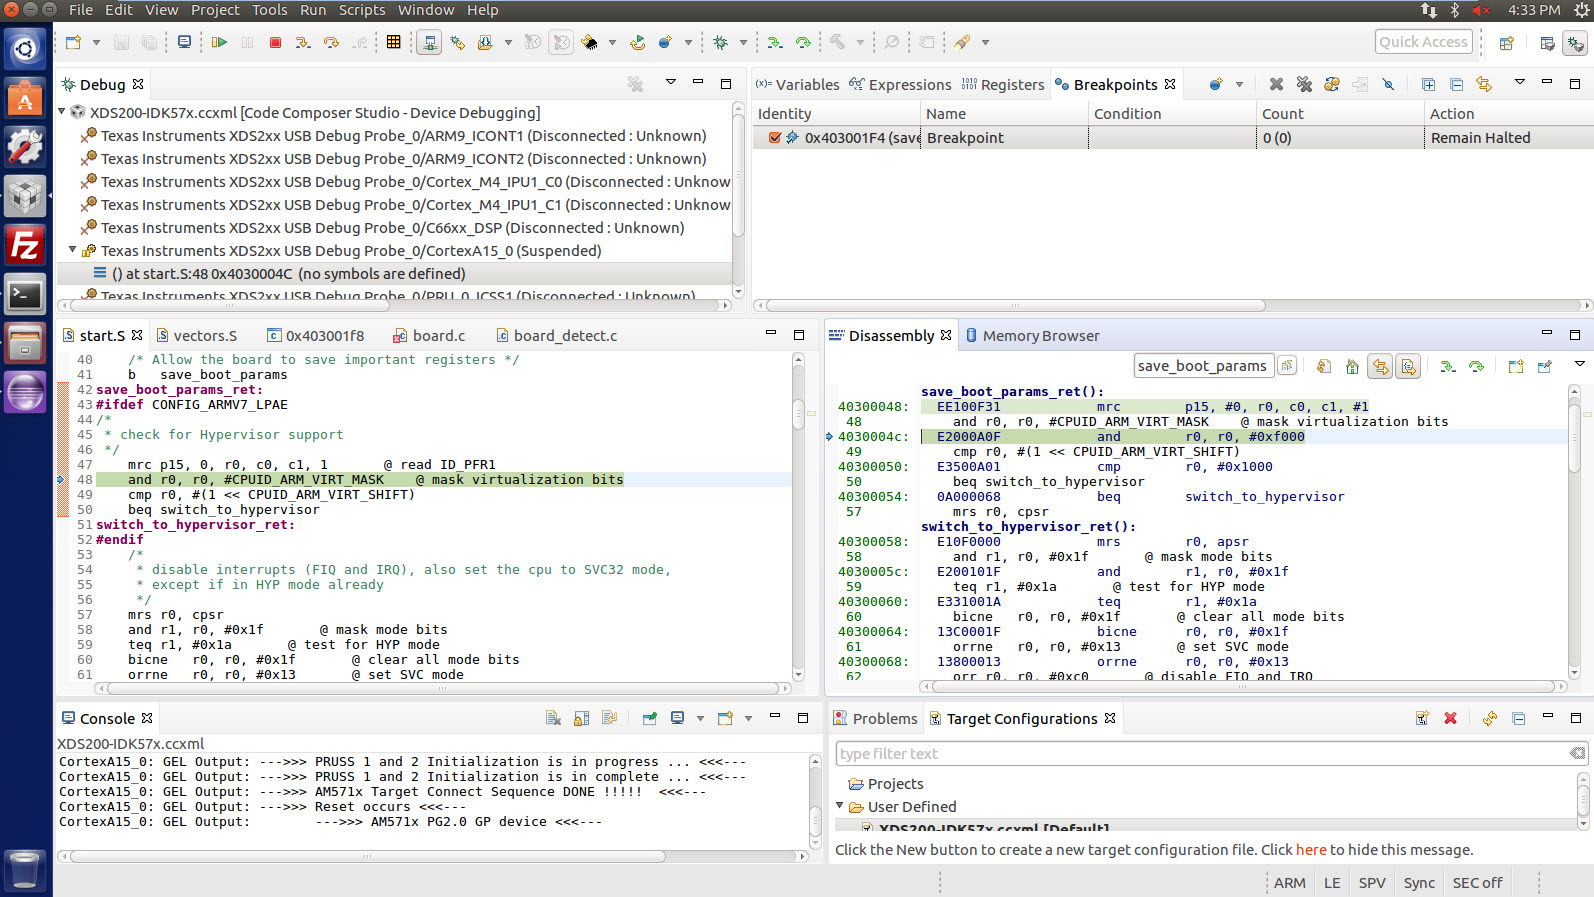
I can launch debug config, connect to target (ARM0). I loaded "ti-processor-sdk-linux-rt-am57xx-evm-05.00.00.15/board-support/u-boot-2018.01+gitAUTOINC+131dc82830-g131dc82830/spl/u-boot-spl.bin" into memory. I loaded the symbols: /home/chchlee/ti-processor-sdk-linux-rt-am57xx-evm-05.00.00.15/board-support/u-boot-2018.01+gitAUTOINC+131dc82830-g131dc82830/spl/u-boot-spl

I set the PC to 0x4300000.

In the disassembly window I see the start:
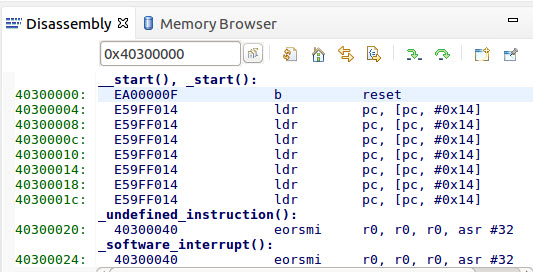
I can also single step and set HW breakpoint in the disassembly window. So far so good. 

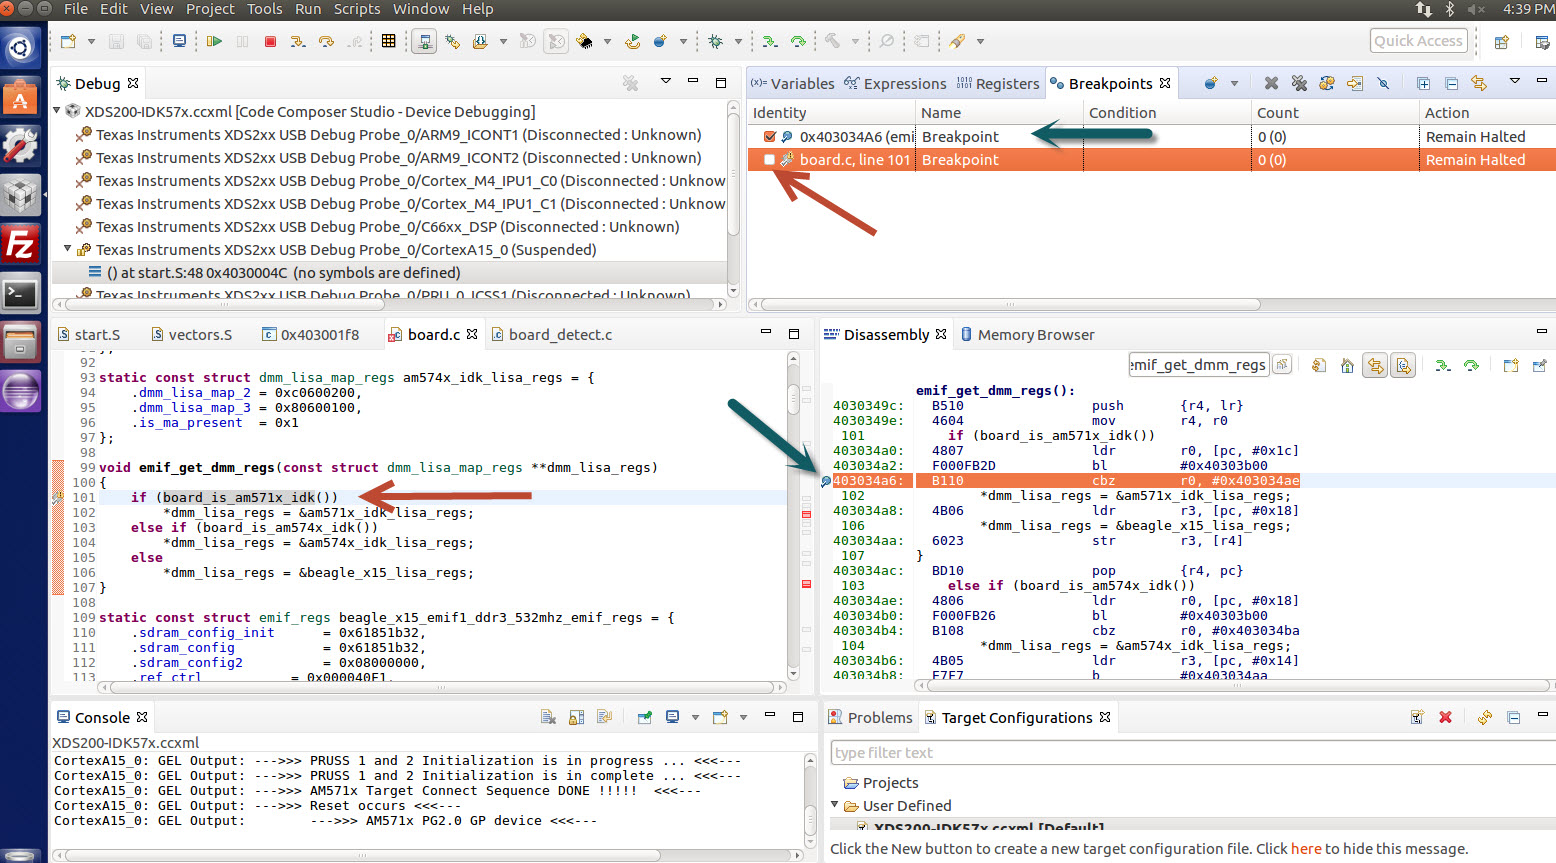
Now I tried to set a HW BP in board.c, emif_get_dmm_regs(). I get:
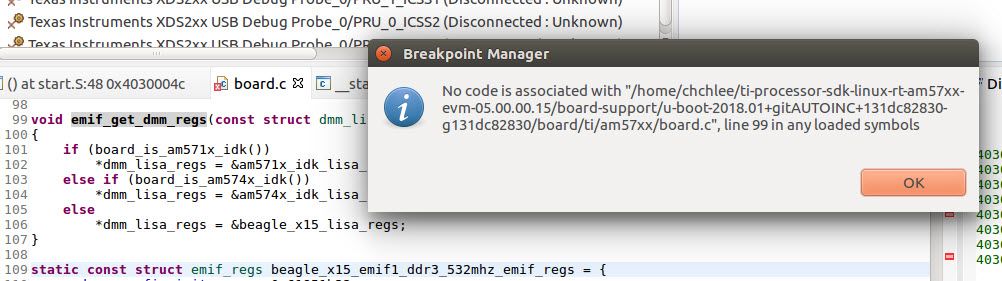
So why does this association not work?

Then I tried to find the address of the function emif_get_dmm_regs() in u-boot-spl.map and entered it in the disassembly window:

Here I can activate a HW BP. But if I hit resume the CPU does not stop at the breakpoint. I strongly assume that this function is called by SPL.

If I do not set any breakpoint and hit resume sometimes I get the expected console output "Please RESET the board...". Most of the times it hangs and after hitting suspend the PC is 0x0000000c.

Regards, Chris

  • Chris,

    Thanks for the very detailed post. The procedure you are following is correct but your Disassembly view does not show the correlated source code of the board.c file. This leads me to believe the u-boot/SPL was built without debugging information (only minimal stack frames are present on the ELF executable).

    In this case, you need to rebuild the u-boot/SPL with full symbolic debugging information.

    Regarding not halting at the breakpoint, that is something quite elusive - some people reported this but, when I try to reproduce it here, many other factors get in the way such as an inadvertent reset (which clears breakpoints), any other condition that locks the processor before the instruction is reached, etc. If the processor is clear of all these conditions, the breakpoint is usually hit normally.

    In this case I would double check if these conditions may be happening in your case.

    Hope this helps,
    Rafael
  • Hi Rafael

    I added #debug in include/common.h.

    All problems remain.

    Seems that other have the same problem, see https://stackoverflow.com/questions/45682341/how-to-get-u-boot-debugging-symbols

    Since we are using TI HW and unmodified TI Software and recommended debug probe, I'd glad if you could test and come up with a solution. Some questions:

    - for debugging SPL,  should I load ./spl/u-boot-spl.bin (as suggested in the TI traning video) or ./MLO?

    - while source file contains the first lines of code. I tried ./arch/arm/cpu/arm7/start.s but again does not to be in sync with disassembly.

    - Pls. propose a c-code function in board.c where I can set a break point.

    - Is the code of board.c already relocated? If yes, where to get the relocated address and how to set?

    Thank, Chris

  • Chris,

    Please apologize for the delay; I missed your last reply.

    I can't necessarily reproduce the breakpoint issue in my system here; in the short clip below I start after following the procedure you mentioned in the original post: after loading the u-boot-spl.bin to 0x40300000 and loading the u-boot-spl symbols to the debugger. As you can tell, I have full source code correlation on the disassembly view and I am able to properly set a breakpoint inside the function call.

    As you can tell, in the clip the u-boot routine fails to properly initialize the HW with a data abort and the breakpoint is never reached (perhaps due to a reset happening prematurely). Unfortunately I am not the most experienced in the u-boot debugging procedure to provide any useful insights about that, but I will try to contact other colleagues that may be able to provide additional comments.

    When building u-boot I had to enable the option Enable debug information for tools under General setup → Configure standard U-boot features (expert users)

    Regards,

    Rafael

  • Hi Rafael

    I enabled debug info as suggested. Then


    Reset CPU


    Loading memory:

    /home/chchlee/ti-processor-sdk-linux-rt-am57xx-evm-05.00.00.15/board-support/u-boot-2018.01+gitAUTOINC+131dc82830-g131dc82830/spl/u-boot-spl.bin


    Load symbols: /home/chchlee/ti-processor-sdk-linux-rt-am57xx-evm-05.00.00.15/board-support/u-boot-2018.01+gitAUTOINC+131dc82830-g131dc82830/spl/u-boot-spl


    Set PC to: 0x40300000


    I can now see the source code and set HW breakpoints close the entry point and the CPU stops when hitting a breakpoint


    If I open board/ti/am57xx/board.c I cannot set breakpoint in the source (red arrow). If I look for the symbol in the disassembly I can see the code and set breakpoints (green arrow):

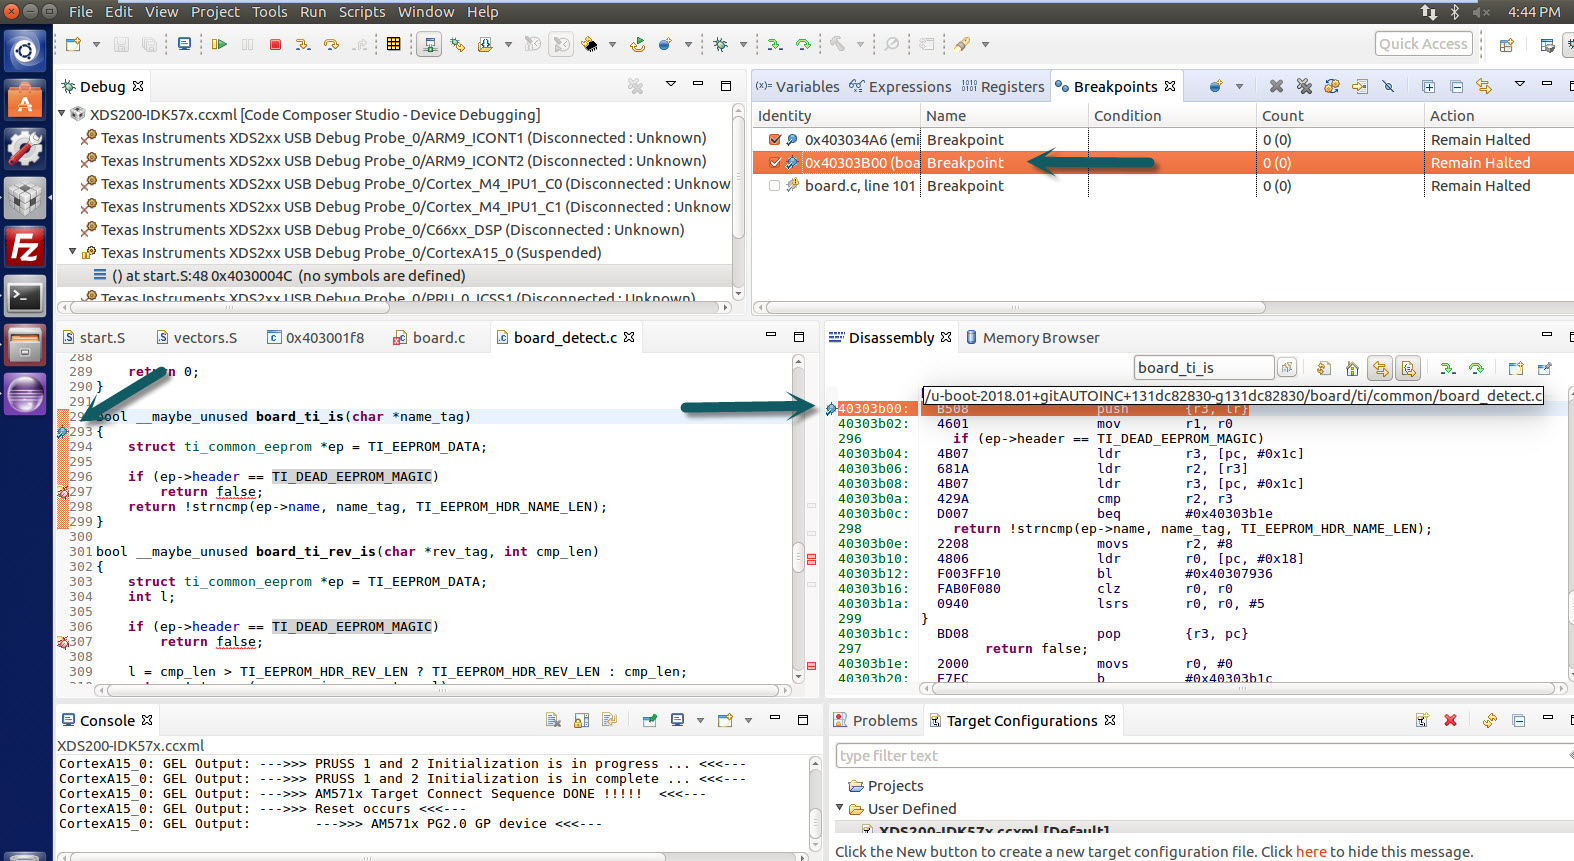
    If I set a breakpoint in the module board_detect.c I can set a breakpoint in the disassembly and it also appears in the source. If I try to set the same breakpoint (same location) in the source it does not work:

    Finally if I hit Resume, the target does not stop at any breakpoint.

    Did you come to the same conclusion? I saw that in your video, stopping at breakpoints did not work either.

    Is the code relocated, so we have to specify an offset when loading the symbols?

    Any hint appreciated.

    Regards, Chris 

  • Chris,

    I am glad you got some progress on this. I will do some additional experiments with the breakpoints and relocation tomorrow.

    After u-boot relocates, you can Add more debug symbols to the mix by going to menu Run --> Load --> Add Symbols (or Load Symbols, if you want to discard the previously loaded symbols). A Dialog box will open and it will have fields for Code and Data offset. I can't tell for sure, but I suspect the values will be similar to what is mentioned in the stack overflow discussion you linked.

    Regards,
    Rafael
  • Chris,

    After the u-boot code relocates, I was able to load symbols but using the offset 0xFFF67000 (as shown in the u-boot parameter relocaddr and not reloc off in the stackoverflow thread you linked).  

    Just one additional detail: the disassembly view is not properly acknowledging the core mode - it is showing ARM instructions while the core is in Thumb mode. 

    To workaround this, simply right-click on the middle of the view and select Disassembly Style --> Thumb Only.

    Hope this helps,

    Rafael