This thread has been locked.

If you have a related question, please click the "Ask a related question" button in the top right corner. The newly created question will be automatically linked to this question.

CCS/AWR1642BOOST: Do I have to reboot AWR1642 BOOST board every time after some debugging actions?

Part Number: AWR1642BOOST
Other Parts Discussed in Thread: AWR1642

Tool/software: Code Composer Studio

Hi TI,

I am trying to debug the Automotive SRR lab with AWR1642 BOOST. I can set breakpoints, view the variables, etc. with no issue. Fyi, I flashed the device with xwr16xx_ccsdebug.bin as indicated in the QuickStart. And if the dss/mss program's breakpoints were triggered, the demo gui was also frozen, which I think should be intended. However, if I resume the program after some step over/into actions, the gui is still frozen. And even I restart the gui, it could not show any plot unless I power cycle the AWR1642 board. Is this inconvevient behaviour by design? Thanks a lot!

Kind regards,

Kathy

  • Hi Madhvi,

    many thanks for your reply. I did see the crashing information you mentioned.

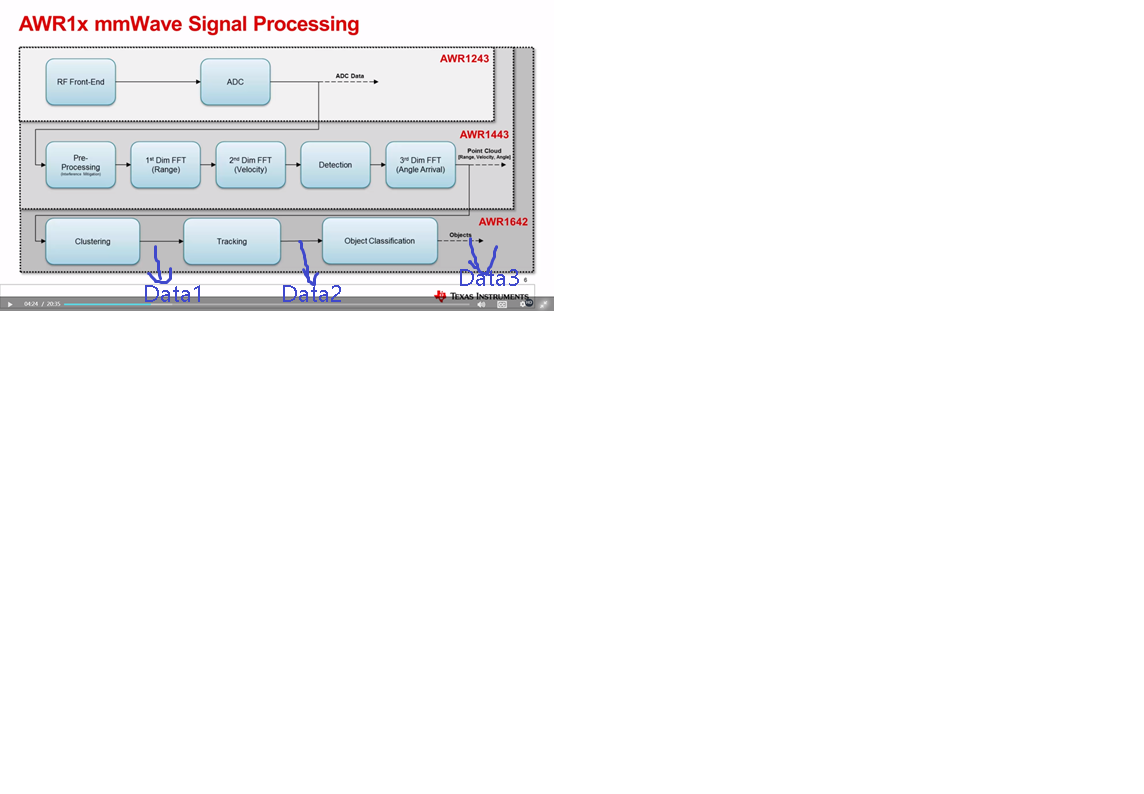
    My goal is to directly get the Data2 (as shown in the picture below) because it's the input for my object classification algorithm.

    Actually, visualizations are not important for me. I only need the data after the tracking step. I think Data2 should be composed of location, velocity as well as range profile and range-doppler matrix data etc. which are extracted from radar echo. In my previous question(e2e.ti.com/.../741446), the TI experts suggested me to refer to SRR application because it has the tracking process. So I tried to read through the code of DSS and MSS ccs projects in SRR demo. And they also mentioned in the thread that "trackerOpFinal" has the tracking output and I may need to write my own code to export this data. But after I looked into the populateOutput function containing the population of "trackerOpFinal", I found the member variable only contains location data (please correct me if I am wrong).

    I am still trying to figure out which member variables (of the MmwDemo_DSS_DataPathObj structure, perhaps) contain the information I need. And that's why I was using the debug mode to watch the variables at runtime.

    kind regards,

    Kathy

  • Hi Kathy

    I would suggest that you don't need to put breakpoints to watch variables per se. See section "Viewing expressions/memory in real time" in SDK user guide for how to watch variables in real time. One more thing you could do is to change the SRR demo to run some finite frames and then examine the data structures for the last frame but this may be similar in experience as putting the breakpoint and letting the cores crash.

    -Madhvi
  • Hi Kathy

    After you resume, does CCS window show MSS or DSS in the crashed state? It is not recommended to use breakpoints or single stepping when the system is working in real time mode as it causes the MSS/DSS and Front end to be in non-synchronized mode. In OOB demo, we usually throw an exception when we detect this non-synchronized nature - maybe in SRR demo, MSS/DSS are trying to catch up. 

    Could you explain what are your goals for debugging and based on that we could provide you some alternatives?

    -Madhvi