This thread has been locked.

If you have a related question, please click the "Ask a related question" button in the top right corner. The newly created question will be automatically linked to this question.

CCS/TMS320F28035: Issue with CCS V.7 Debugger

Part Number: TMS320F28035

Tool/software: Code Composer Studio

Hi All,
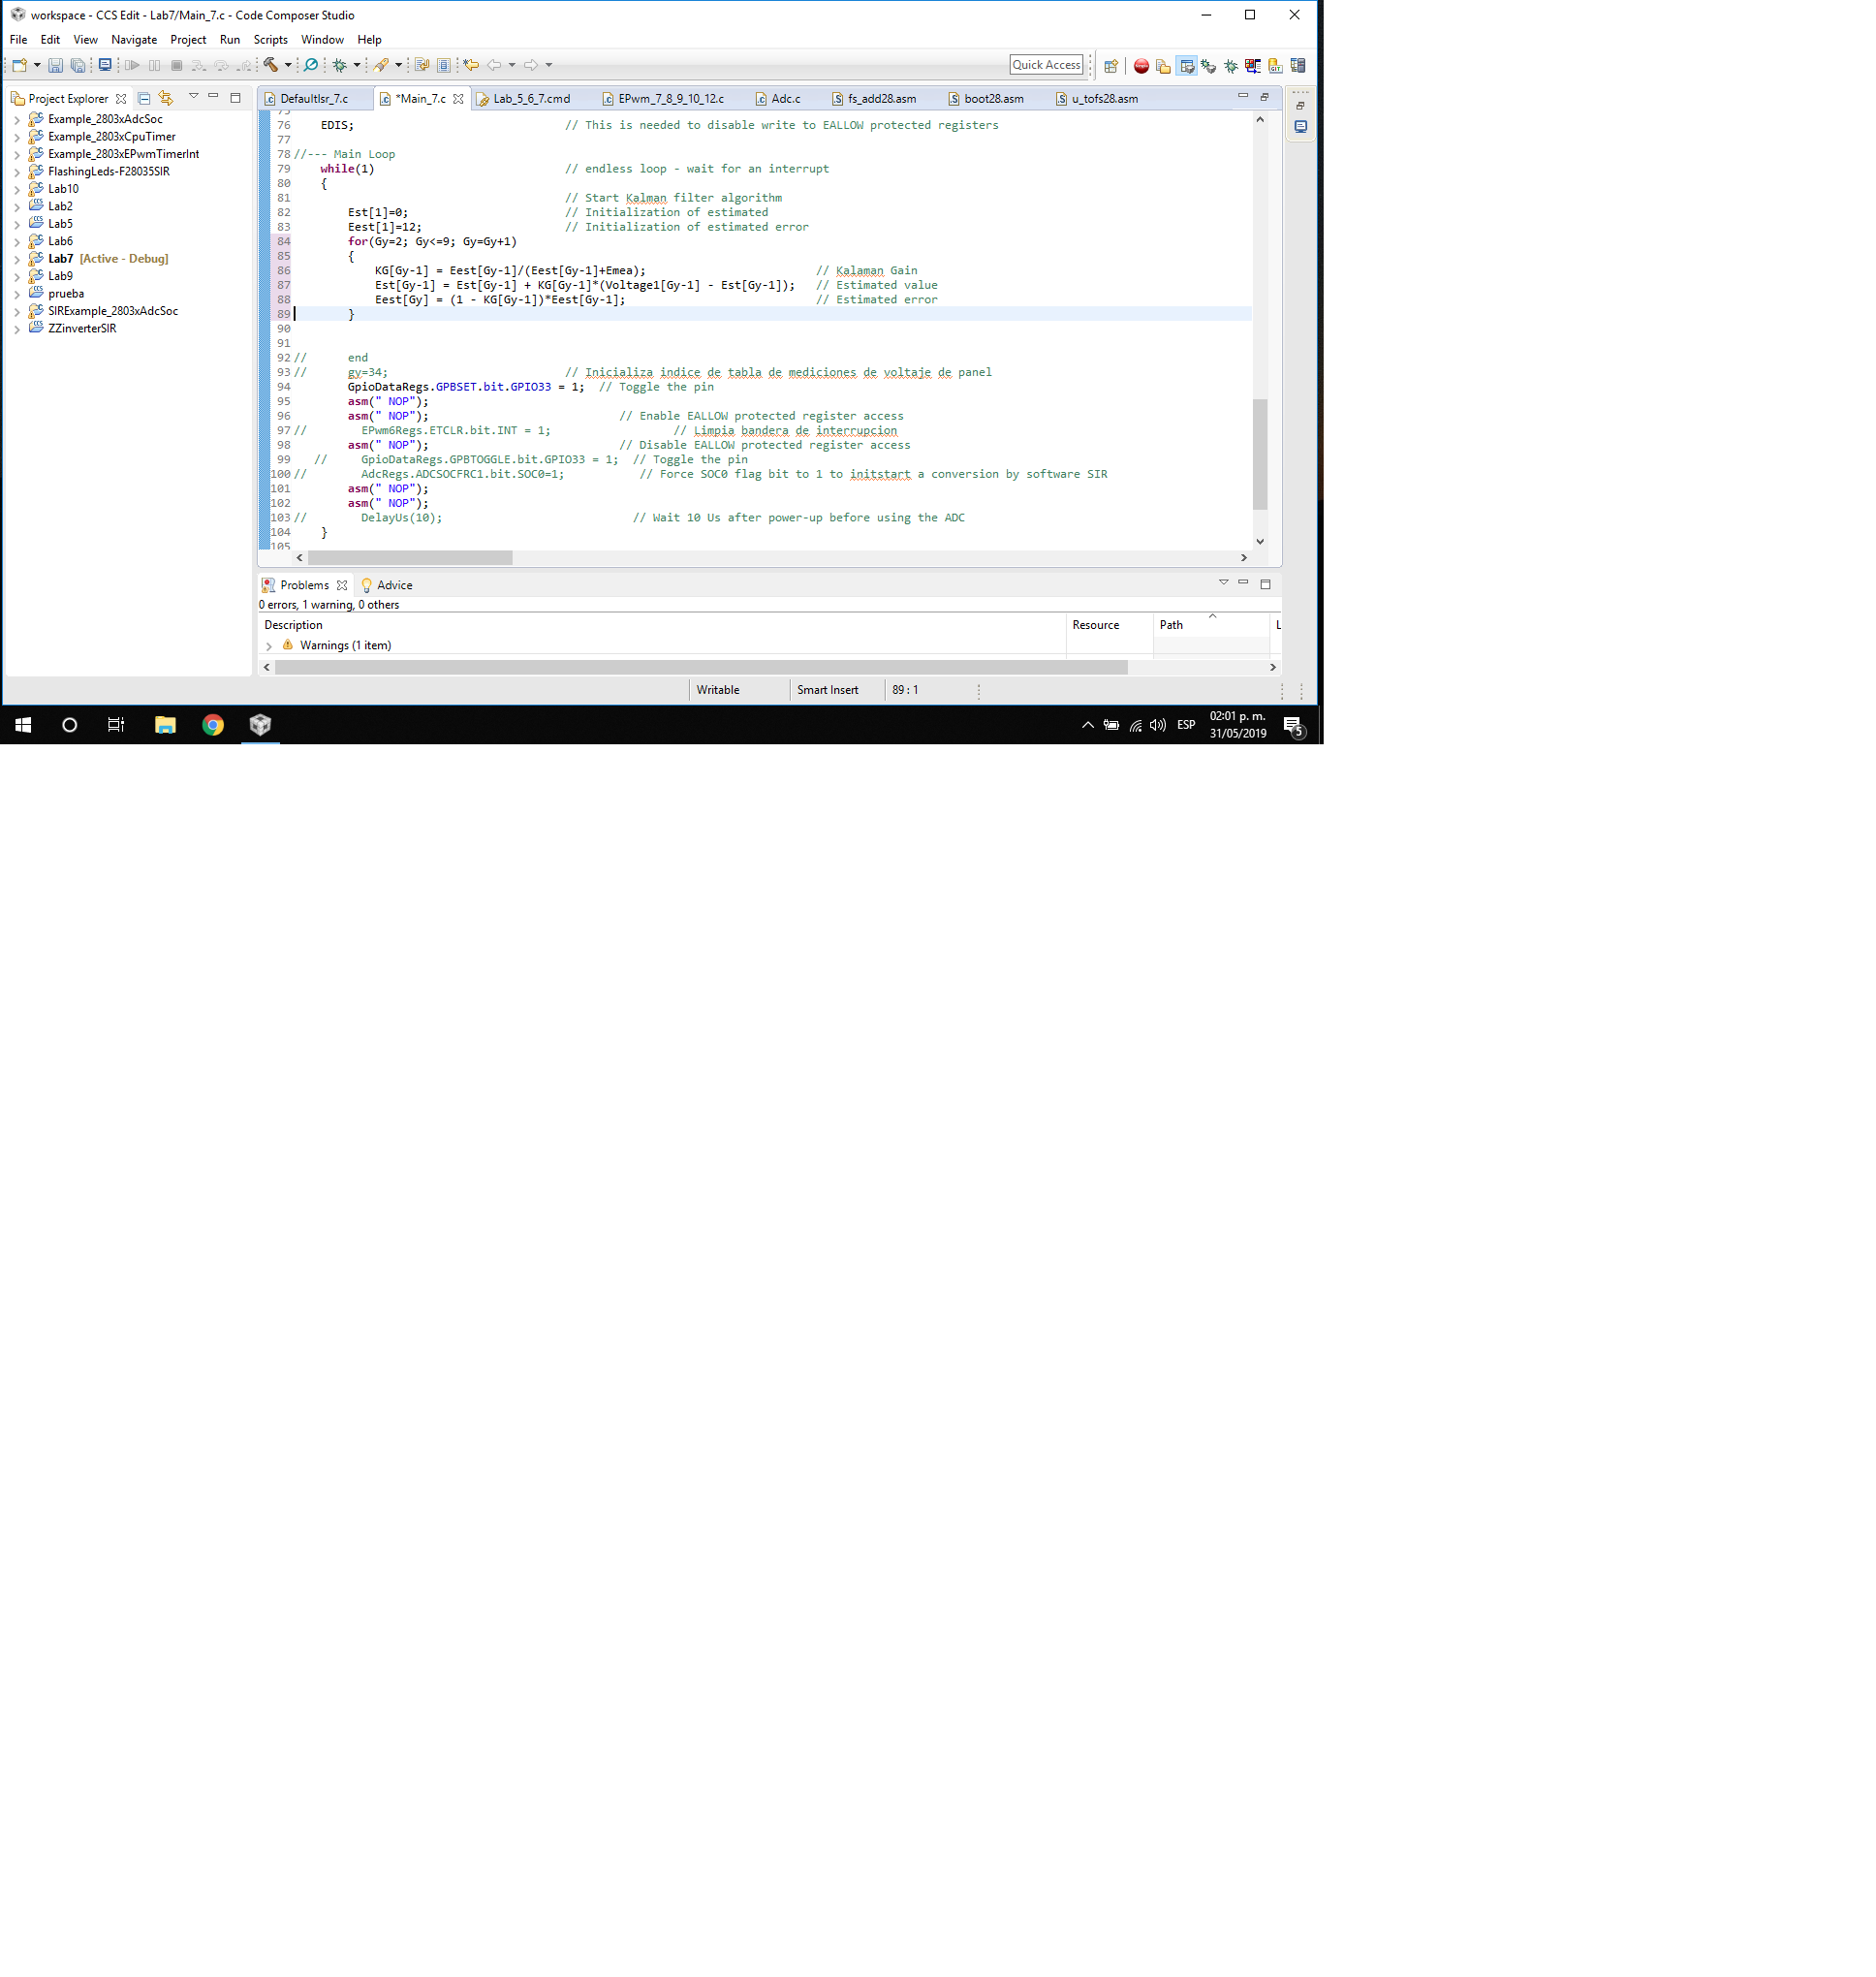
I have a issue with the debugger. I´m using the experimenter kit with the TMS320F28035 microcontroller. When I´m debugging my program and I try execution step by step in a secction where I´m making several calculus in the window of edition of CCS appears assembler files, then the execution step by step pass to the assembler file.
I don´t known what happen.

I send the screen view where I show the for cycle in my main program.

Thanks a lot

  • Hello,

    Without more details, it is hard to say with any certainty. The first thing that comes to mind is if you have any optimization enabled. This can certainly impact source line debug visibility:

    http://dev.ti.com/tirex/explore/node?node=AEm7LJjS34iFPa5fpT7ttQ__FUz-xrs__LATEST

    Thanks

    ki

  • Hi Kee-Soo Lee
    I´m working with the CCS V.7. I modified the file where its my main program, specificaly, I have change the Optimize for speed from 2 to 5. Then I can debug my main program step by step.
    But, what i can do to that my project excutes correctly and I can debug all?
    I need develop a big program because I´m developing a photovoltaic inverter. My experience in C++ is litle, but I can study. In another projects I used assembly language and never had this kind of troubles with the develop tools.
    What do you recomend to me for make my job?

    Thank you very much in advance
  • S.Ibarra said:
    I have change the Optimize for speed from 2 to 5

    I assume that is for the --opt_for_speed option. But what is the --opt_level value?

    S.Ibarra said:
    But, what i can do to that my project excutes correctly and I can debug all?

    As mentioned in the article I mentioned in my last post, you can first try disabling optimization (set --opt_for_speed to off). This will give you best debug visibility. Make sure everything works as expected. Once you validated that it does, then you can enable optimization again.

    Thanks

    ki

  • Hi, Ki


    Considering your advices I modified the --opt_for_speed from 5 to 0. Furthermore I reviwed the optimization level and this option is disabled.
    I send the screenviews of both options.


    I can´t debug my program because when I try execute the program step by step, the program counter go to the assembler programs.
    My code is very simple now, but I will several routines more complex and I need debug these . How can I do?

    Thank you very much.

    Sebastián

  • S.Ibarra said:
    I can´t debug my program because when I try execute the program step by step, the program counter go to the assembler programs.
    My code is very simple now, but I will several routines more complex and I need debug these . How can I do?

    Can you provide a test case? Project+source+executable

    Thanks

    ki

  • Hi Ki,

    I send my project in a zip file. I´m using Lab7 (workshop example) as framenwork. 

    Thanks a lot.

    SebastiánLab7.rar

  • Hi Ki,

    I send my project in a zip file. I´m using Lab7 (workshop example) as framenwork. 

    Thanks a lot.

    Sebastián8468.Lab7.rar

  • Thank you for the example. I am able to load and run it. However I am trying to understand what you meant by:

    S.Ibarra said:
    . When I´m debugging my program and I try execution step by step in a secction where I´m making several calculus in the window of edition of CCS appears assembler files, then the execution step by step pass to the assembler file.

    I source stepped through the main loop (lines 82 - 109 in Main_7.c) and did not have any issues. It stepped through the source lines the whole time. Can you explain in more details what behavior you see that is the issue?

  • Hello Ki,

    When I execute the program with a breakpoint in line 87. The CCS V.7, in the console window appears the following error: "C28xx: Breakpoint Manager Error enabling this function: This function cannot be accomplished with the existing AET resources. Then the program counter goes to an assembler file.
    Furthermore when I Build my program again and try debug the CCS doesn´t let me execute the program, because the butom of run it's disabling.

    Thank you very much.

    Sebastián...

  • S.Ibarra said:
    The CCS V.7, in the console window appears the following error: "C28xx: Breakpoint Manager Error enabling this function: This function cannot be accomplished with the existing AET resources.

    Ah! This is the key piece of information I needed. I understand the issue now.

    A HW breakpoint (which is required when setting a breakpoint in flash memory) uses up an emulation (AET) resource. On the 28x, there are very few of these resources. For example, 28x only has enough resources for 2 HW breakpoints. If you set more than two, you cannot set any more - and you will get that error you mentioned. Other things also use a AET resources under the hood. Another example is single source line stepping. This is because a single source step uses a breakpoint under the hood (it sets a breakpoint on the next line and runs to it). If you are single source stepping code in flash, then that would use a HW breakpoint. If you have no more AET resources, then you will not be able to single source step (which is why it forced you to an assembly step). Try removing that breakpoint on line 87 after you reach it. Once you remove it, you will likely be able to single source step without issue.

    Thanks

    ki  

  • Hi Ki,

    In agree with your advices I removed the breakpoint. But the debugger continues enter to assembler files. I doesn´t have confidence with the performance of the CCS, because executing my code (three code lines) does not generate different results, when I did change the input conditions. Additionaly I installed the CCS V.8 in another computer and export my project and in two ocasions I tried build the program, then, the computer be reset in both oportunities.

    Thank you very much.

    Sebastián

  • Make sure all breakpoints are disabled when single source stepping. The AET error is because the emulation resources have all been used up. Also note that things like the profile clock also uses an AET resource. 

  • Hi Ki,

    I´m following your advices, but the issue continues, i.e., I can´t execute my program step by step. My program is elementary, now, has three code instructions. I´m worried because the CCS V.7 doesn´t funtion conveniently. Do you belive that I need migrate to another platform?
    TI has some tool that I can use with the piccolo microcontroller?
    I need to use assembler code?

    Thank you very much.

  • Your example works fine with my CCSv7.4 installation, once I disabled the HW breakpoint. Let's try fresh - use a new workspace and create a new target configuration file. Then when you start a debug session for the project, do not set any breakpoints. just single step through your code.