This thread has been locked.

If you have a related question, please click the "Ask a related question" button in the top right corner. The newly created question will be automatically linked to this question.

CCS/TMS320F28377D: CCS V8.3 - local watch variables not working

Part Number: TMS320F28377D


Tool/software: Code Composer Studio

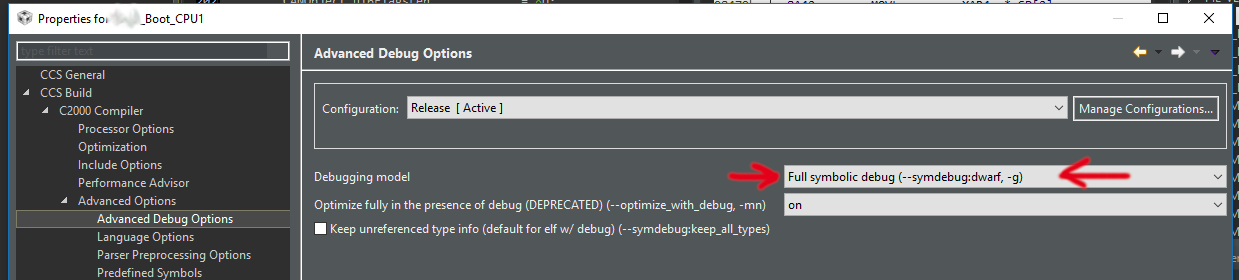
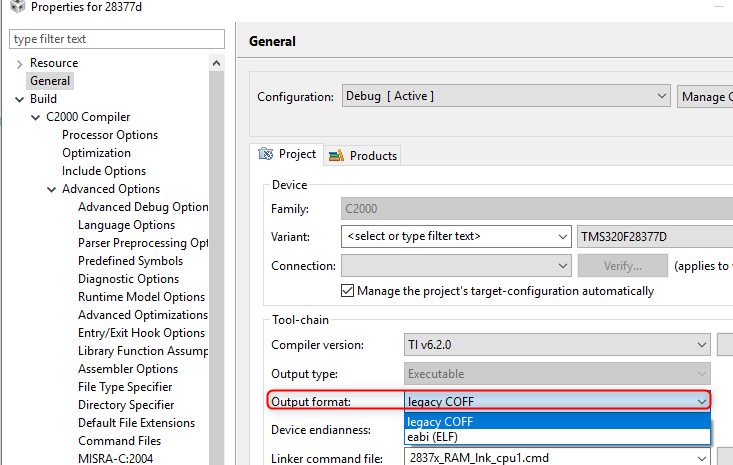
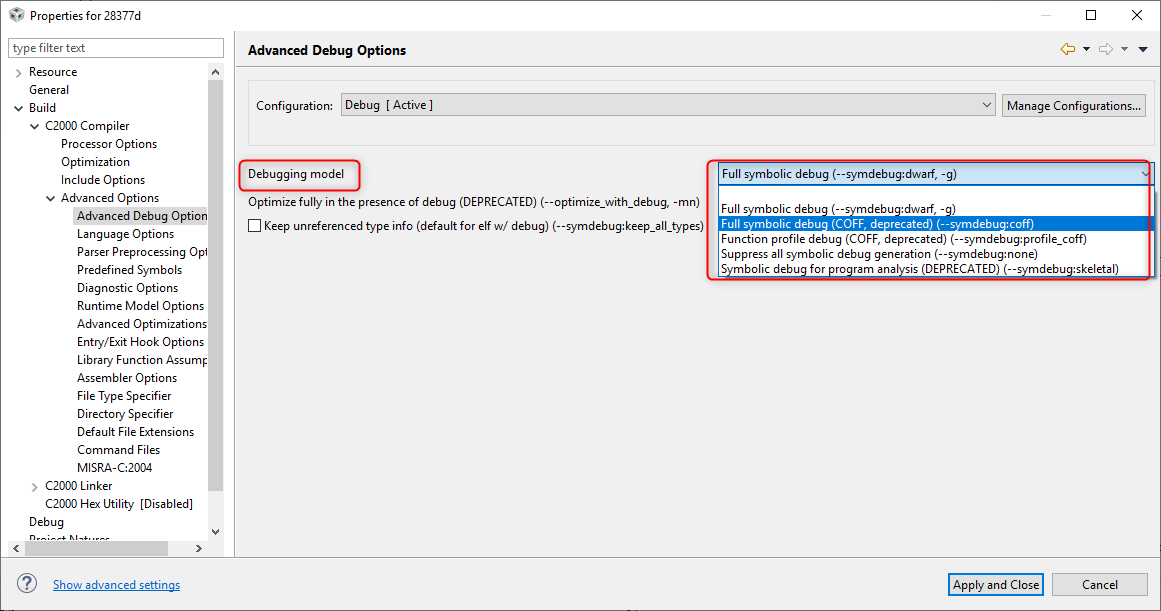
I am using CCS V8.3 with Win10 and a Blackhawk USB200 debugger on a Delfino TMS320F28377D dual core. I have code optimisation turned off (0) for both cores. Speed 5. Complier TI v6.4.3, legacy COFF.

When debugging and stepping though a function, local variables do not get read correctly. The local variable is within scope. In the Variables and in the Expression windows the value read is usually zero, but not always.The address is similar to 0x000051F0@Data, which cannot be correct as the local variable is on the stack. If I open a Memory Browser window, I can see the stack SP at 0x400 and also see my local variables correctly changing as I step though my function, for example at stack address 0x442.

Watched global variables work fine always, local variables never work. The stack is of size 0x400 and little used, I think it is plenty large enough.

I would be grateful for any ideas what the problem could be?

Here's a screen shot showing the incorrectly read local variables and the correct value (0005) on the stack in Memory Browser window:

  • Hi Steven,

    Steven Probyn said:
    I have code optimisation turned off (0)

    '0' is not 'off'. To turn it off, you need to explicitly select 'off':

    Please turn off all optimization and see if you can reproduce the issue 

    Thanks

    ki

  • Hi Ki,

    sorry for the confusion, it was already set to 'off', not 0. This is how I have optimisation set, which gives me the no local variables problem:

    With thanks,

    Steven

  • Can you share your project (source + executable)? If not, a reproducible test case would be great too.

    Thanks

    ki

  • Hi Ki,

    unfortunately I can't give a copy of the project. But I will try next week to provide a test project which shows the issue.

    Thanks,

    Steven

  • Thanks, that'd be great. 

  • I found a solution to my problem. In Project properties, Advanced Debug Options.

    We use this setting as default in our company:

    But if I change the Debugging model setting to be as shown below, then the local watch variables work fine! The address used in the watch window is a stack location, as it should be.

    Why is this the solution, and which setting do you recommend we use as standard? Is there any disadvantage to using 'Full symbolic debug (--symdebug:dwarf, -g' instead of "Full symbolic debug (COFF deprecated:coff)? 

    With thanks,

    Steven.

  • Good catch.

    DWARF debug symbols has been the default for some time now. It has much more information than the old STABS format.

    And yes, the old debug format was STABS. The text in that drop down menu for the 'Debugging model' is misleading. COFF is technically a file format (like ELF). 

    Hence the options in the below screenshot for the file output format make sense, and is technically correct:

    But the drop down for the debug symbol format is not technically correct:

    COFF is NOT a debug symbol format. It is a file format like ELF. 

    DWARF is a debug symbol format. Another debug symbol format is STABS. In the last screenshot, 'COFF' really refers to 'STABS'. 

    That is why you can select COFF for your file format but select DWARF for your debug symbols.

    the reason for the confusion was TI was historically COFF/STABS for the file format and debug symbol format. Somewhere along the way, people just referred to everything as just COFF format, hence the confusion and why debug symbol information is sometimes referred to as 'COFF'.

    At least this is my understanding of events. 

    While STABS is deprecated in support, this looks like a bug that should be fixed in CCS. I filed a bug for this. Tracking ID: CCBT-2475

    If it is not an issue, I recommend building with DWARF symbols instead.

    Steven Probyn said:
    Is there any disadvantage to using 'Full symbolic debug (--symdebug:dwarf, -g' instead of "Full symbolic debug (COFF deprecated:coff)? 

    DWARF is better in every way with the exception that the generated symbols will be larger (2x to 3x larger I think). But this is only for the debug symbols that get loaded to the debugger. There is NO impact on the actual code size of the program.

    Thanks

    ki

  • Hi Ki. Thanks for the detailed explanation.

    I will switch to using the newer DWARF debug format and recommend that my colleagues do the same.

    Cheers, Steven