


Part Number: TMS320F28377D
Tool/software: TI C/C++ Compiler
Hi,
Previously I encountered a problem where the copy of BINIT table was taking too long so that the watchdog is triggered during stand-alone boot.
The problem was solved by disabling the watchdog in code_start. However, if I connect the device to the debugger and the device is being debugged, the application works fine, and watchdog is not triggered.
The TI engineer who answered my previous posts said that when the device is being debugged, debugger will automatically disable the watchdog, which I have checked that after loading the program and the application being taken to main(), watchdog is disabled.
But what confuses me is that during debug, after I "reset" in CCS and "resume", the application works fine as well. Here is what I did:
1. Load the application to flash and chose the emulation boot to flash. After loading, I saw that the watchdog was disabled and application stopped at main().
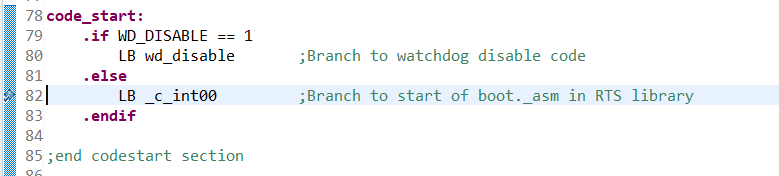
2. In code_start, I do not disable the watchdog.

3. Put a breakpoint at the beginning of code_start.
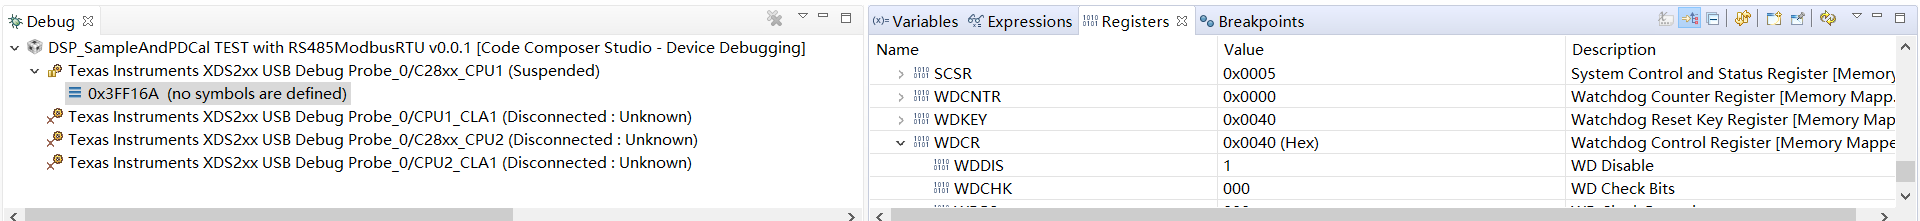
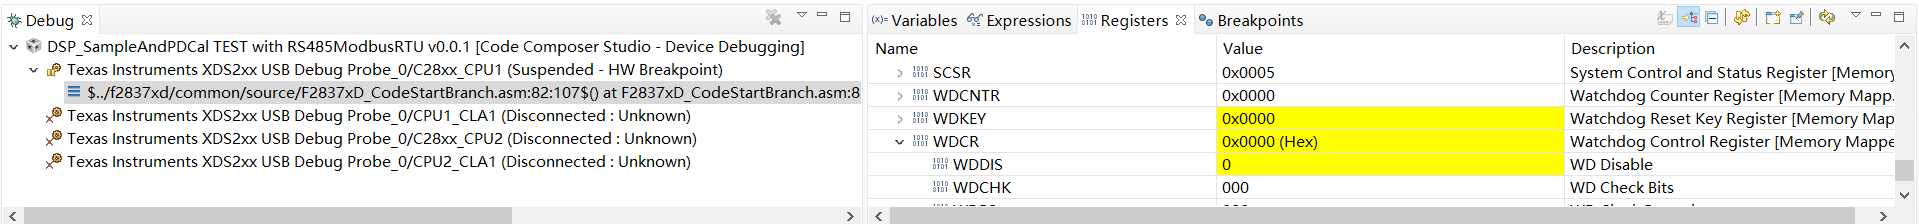
4. After "reset", watchdog was disabled. But after "resume" in CCS and the application stopped at the start of code_start. watchdog was enabled again(checked WDCR register).
After "reset":
After "resume" and stopped at "LB _c_int00":
Now in theory, after "reset" and "resume", device will go through the emulation boot flow, and trigger the watchdog since it has not enough time to copy the BINIT table, and watchdog is enabled again after the emulation boot flow and before it enters code_start.
5. I then pressed the "resume" twice, however, the application can safely run to main() where the other breakpoint was inserted and run the rest of its course without triggering the watchdog.
As mentioned above, watchdog was enabled again after "resume"(presumably during the boot flow) and before code_start can even execute, then why the watchdog was not triggered later on? I have checked the RESC register, WDRSn was not set during the experiment. It means that watchdog didn't even triggered. So is this because the time needed for the copy of BINIT table is shorter when the debugger is connected? Or is this because debugger will block the watchdog reset entirely even prevent the WDRSn bit in RESC register from being set?
Regards,
John

