Other Parts Discussed in Thread: TM4C1294NCPDT
Tool/software: Code Composer Studio
I am using CCSV8.3.1.00004, XDS200 debugger SWO trace.
I need to understand setting up the hardware trace analyzer and using:
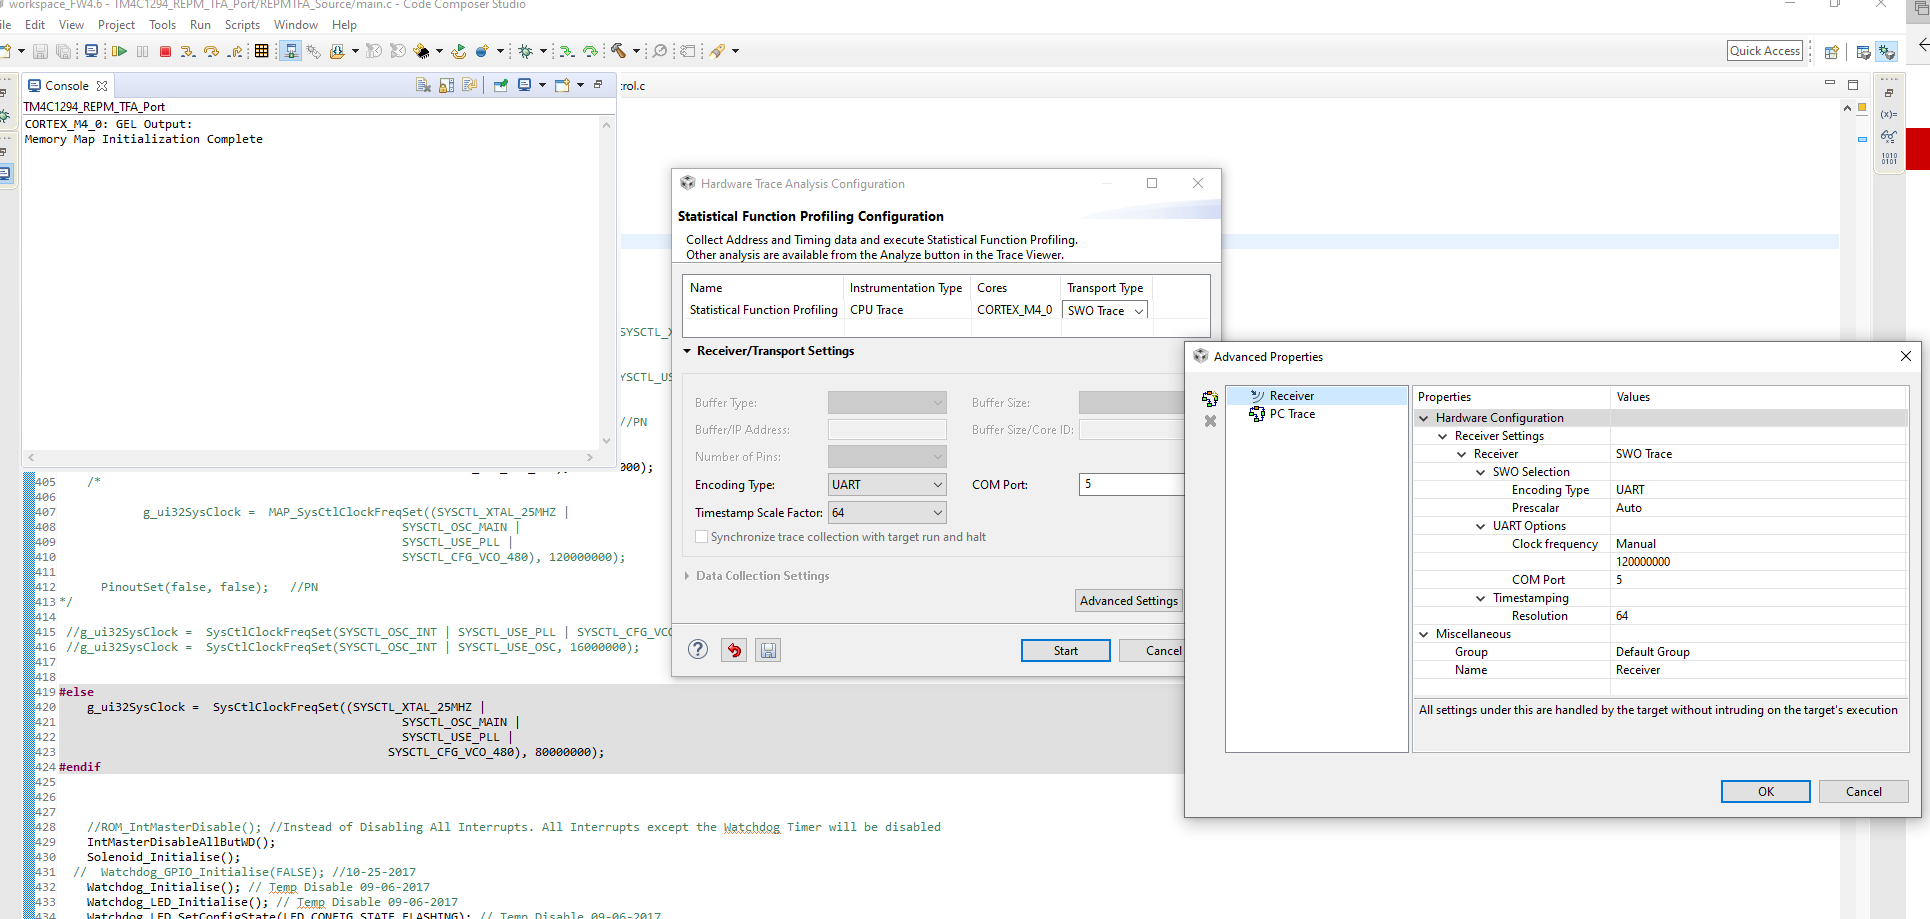
Statistical function profiling
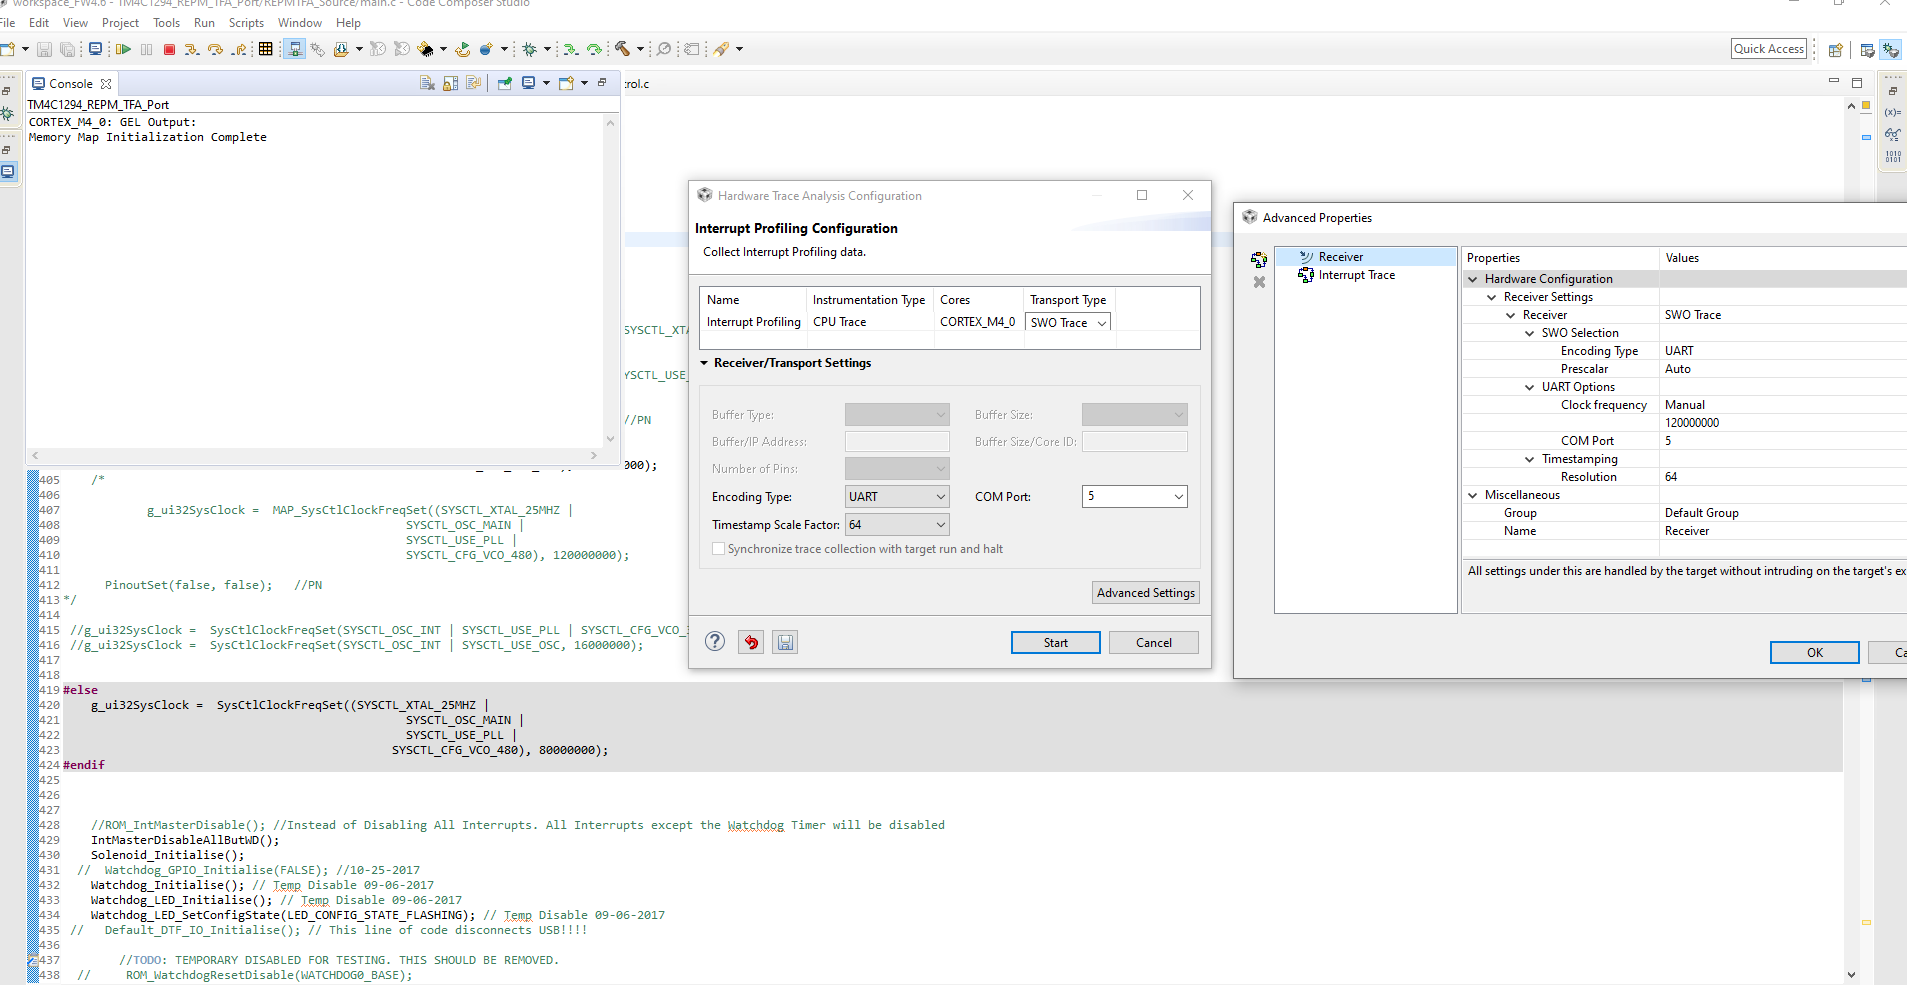
Interrupt Profiling
Attached are screeshots to set up these two methods, they seem identical. I don't see a tab to set the sampling CLK.
Why is this? Where can I find this?
I am using resolution of 64. Is this ideal. I am still seeing OVERFLOWS happen when I interrupt profile 19000 out
of 1.4 million records. How to eliminate this?
How do I change the UART prescalar value? Will this help with the overflow issue?
When I use statistical profiling, I am not seeing any output in the trace viewer at all. In CCSV7
I was able to see something.
It takes a long time, but I was able to export the data to a .csv file.
Please help ASAP. I am on a time crunch and many days have slipped.
Thank you,
Priya
Edited to attach setup pictures and trial run. In the interrupt summary, are the counts the time duration for which the ISR is executing?
Try3.zip