This thread has been locked.

If you have a related question, please click the "Ask a related question" button in the top right corner. The newly created question will be automatically linked to this question.

CCS/LAUNCHXL-CC1350-4: Code uploading problem.

Part Number: LAUNCHXL-CC1350-4

Tool/software: Code Composer Studio 9.2.0 on Ubuntu 18.04.3 LTS


Hi,

I am new to this platform and I believe this might be an easy problem.

I can not  upload the code from CCS /CC1350 Launchpad / empty code to my LAUNCHXL-CC1350-4. I tried to upload other codes as well but I had no luck. I get the error code below. Is anyone have experienced the same problem before?

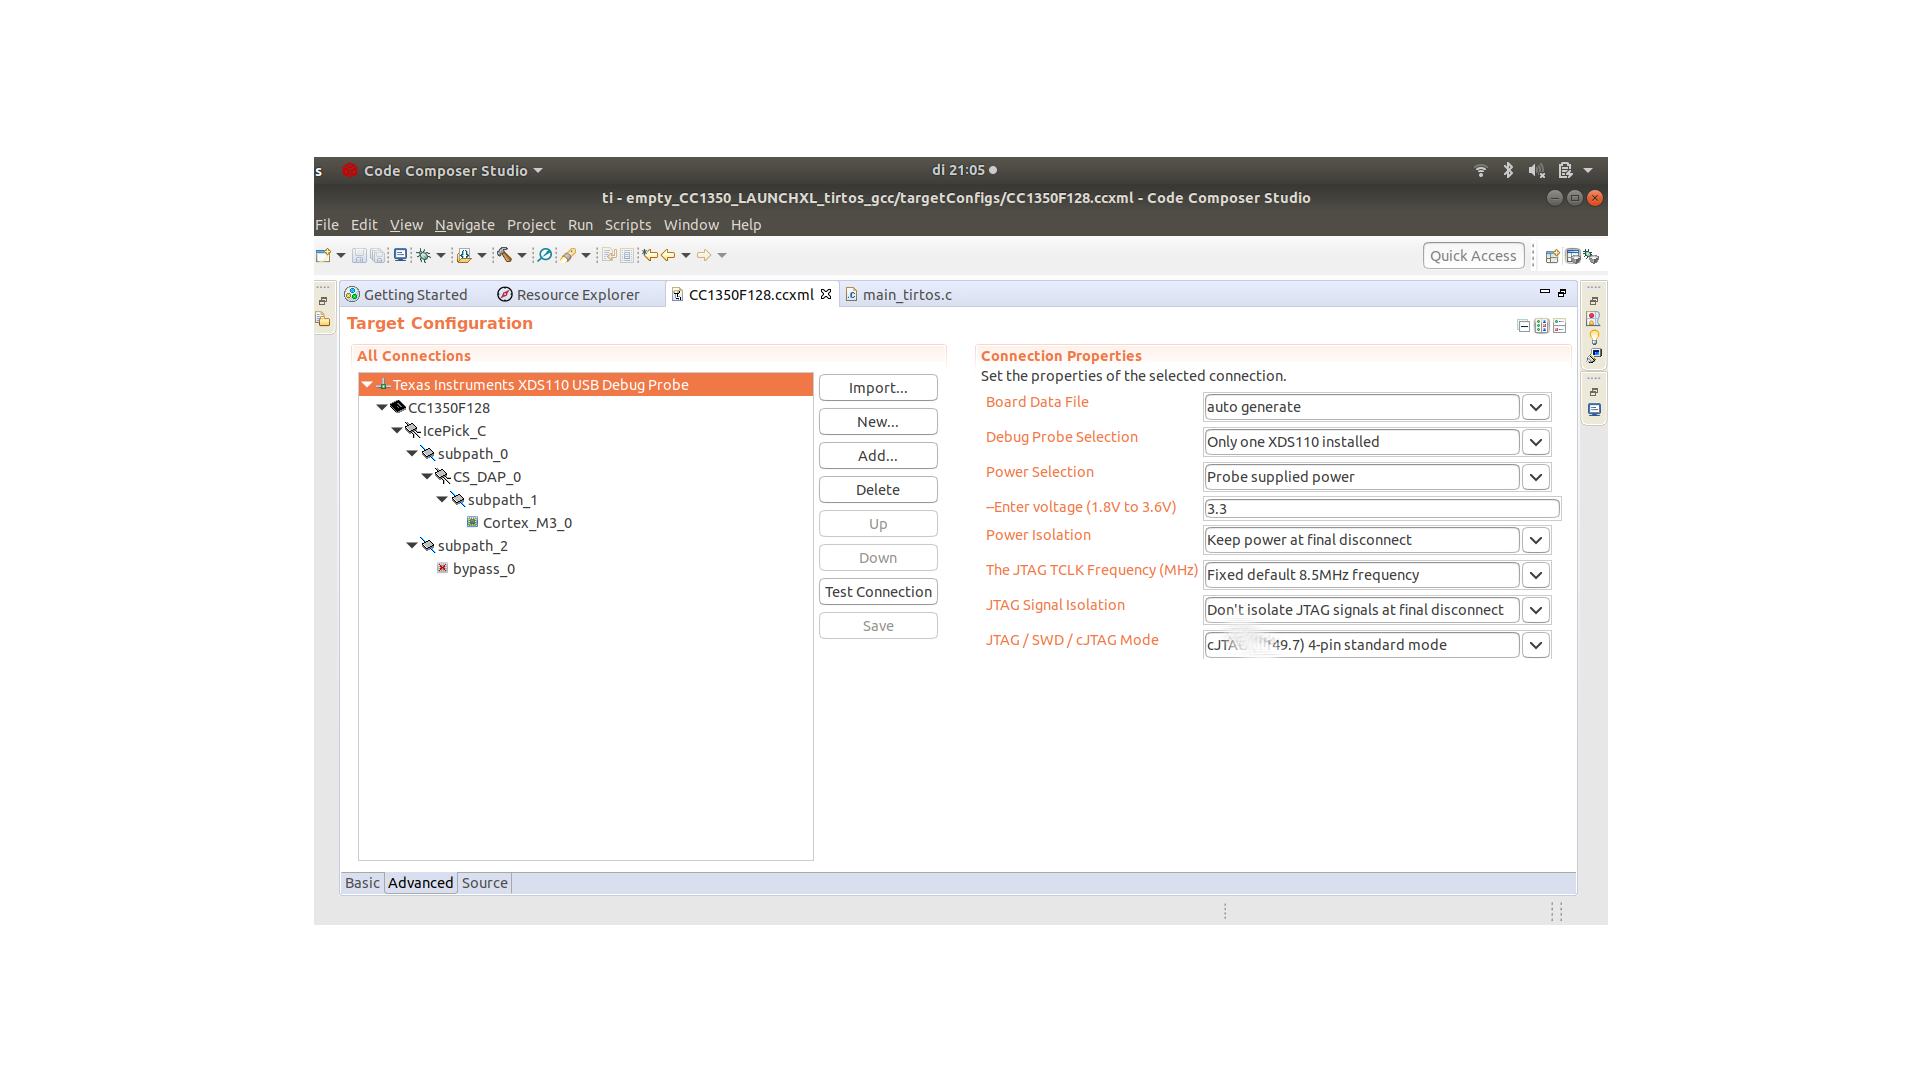
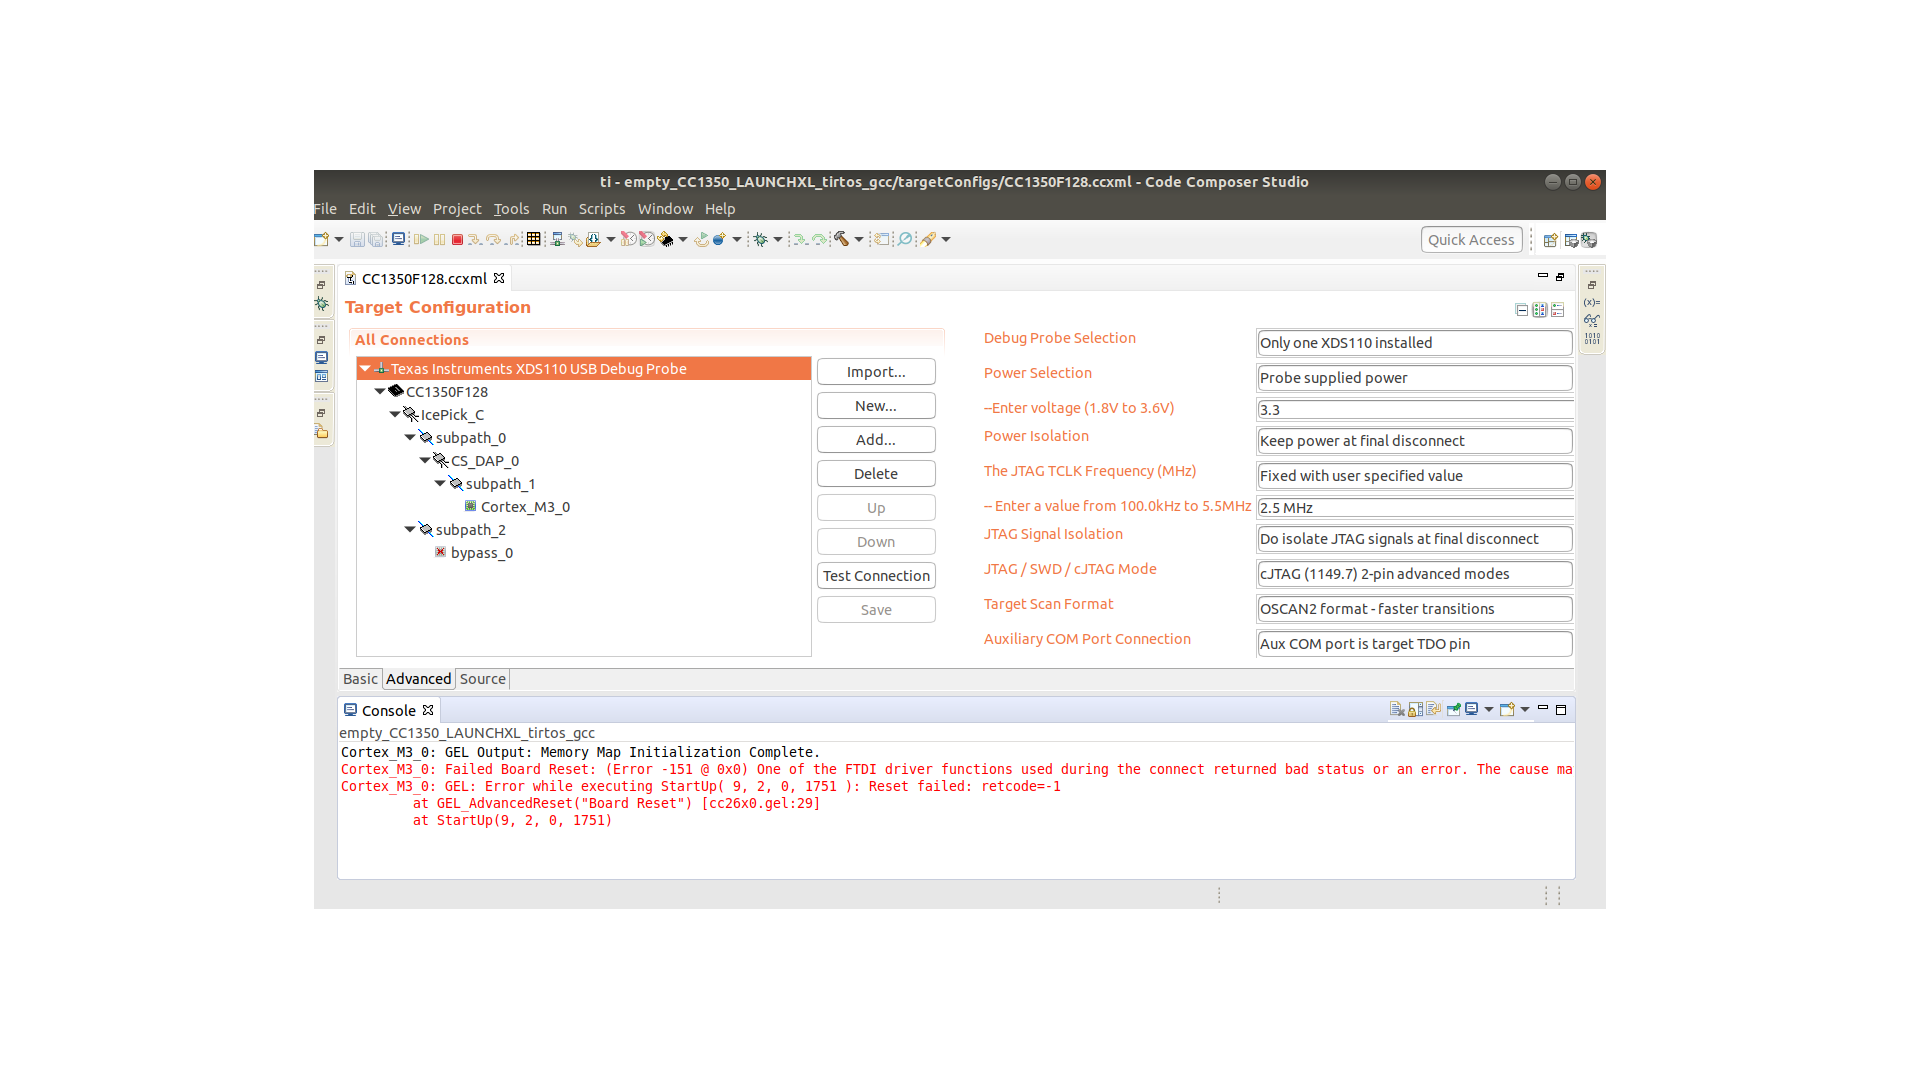
Error connecting to the target:
(Error -151 @ 0x0)
One of the FTDI driver functions used during the connect
returned bad status or an error. The cause may be one or
more of: no XDS100 is plugged in, invalid XDS100 serial number,
blank XDS100 EEPROM, missing FTDI drivers, faulty USB cable.
Use the xds100serial command-line utility in the 'common/uscif'
folder to verify the XDS100 can be located.
(Emulation package 8.3.0.00003)

If I try to use xcd100serial command:

~/ti/ccs920/ccs/ccs_base/common/uscif$ ./xds100serial
Scanning for XDS100 emulators...

No XDS100 emulators were found on the system.

  • Ilhan,

    The CC1350 LaunchPad looks like it has an XDS110 debug probe on it and not an XDS100.  Can you try changing your debug configuration to be XDS110?

    Regards,

    John

  • Hi John,

    This time I am getting the following error:

    Error connecting to the target:
    (Error -275 @ 0x0)
    The attempt to poll a target device exceeded its timeout limit.
    The utility or debugger has requested that a target device be
    repeatedly accessed for a specific data or status value.
    This has failed because the built-in limit for the maximum number
    of attempts when polling the JTAG scan-path has been exceeded.
    (Emulation package 8.3.0.00003)

  • You may find my connection property settings below

  • Hi,

    An explanation about error can be found in the Debugging JTAG page (search for the error number), avaiable in the online help of CCS (menu Help --> Contents) or at the page below.

    https://software-dl.ti.com/ccs/esd/documents/ccs_debugging_jtag_connectivity_issues.html

    That said, yoru screenshots may indicate an issue with th lease change the options on the target configuration file:

    - JTAG / SWD/ cJTAG Mode to either cJTAG (1149.7) 2-pn advanced modes or JTAG (1149.1), SWD and cJTAG are disabled.

    - The JTAG TCLK Frequency (MHz) to Fixed with user selected faster value and in the option that opens down to Fixed 5.5MHz frequency.

    These options should increase the ability to connect to the device. 

    Hope this helps,

    Rafael

  • Hi desouza,

    I tried your suggestions and I also followed the guide in the link. This time I get completely different error. Even after changing the settings back to original state, the following error keeps popping up.

    Cortex_M3_0: GEL Output: Memory Map Initialization Complete.
    Cortex_M3_0: Failed Board Reset: (Error -151 @ 0x0) One of the FTDI driver functions used during the connect returned bad status or an error. The cause may be one or more of: no XDS100 is plugged in, invalid XDS100 serial number, blank XDS100 EEPROM, missing FTDI drivers, faulty USB cable. Use the xds100serial command-line utility in the 'common/uscif' folder to verify the XDS100 can be located. (Emulation package 8.3.0.00003) 
    Cortex_M3_0: GEL: Error while executing StartUp( 9, 2, 0, 1751 ): Reset failed: retcode=-1
    	 at GEL_AdvancedReset("Board Reset") [cc26x0.gel:29]
    	 at StartUp(9, 2, 0, 1751)

  • It still looks like it is using an xds100.  I suspect that a different ccxml file is getting used.

    Can you go to the view menu.  Select Target Configurations.  Browse to your cc1350f128.ccxml file.  Double click on it to open it, make sure it looks like your screen capture.  Go back to the target configurations view and right click on the file and select Launch Configuration.  

  • Tried this as well. No luck. It is the same config file that I am using.

    I am including the log file after I tested the connection.

    [Start: Texas Instruments XDS110 USB Debug Probe_0]
    
    Execute the command:
    
    %ccs_base%/common/uscif/dbgjtag -f %boarddatafile% -rv -o -S integrity
    
    [Result]
    
    
    -----[Print the board config pathname(s)]------------------------------------
    
    /home/neo/.ti/ccs920/0/0/BrdDat/testBoard.dat
    
    -----[Print the reset-command software log-file]-----------------------------
    
    This utility has selected a 100- or 510-class product.
    This utility will load the adapter 'libjioxds110.so'.
    The library build date was 'Aug 26 2019'.
    The library build time was '13:12:35'.
    The library package version is '8.3.0.00003'.
    The library component version is '35.35.0.0'.
    The controller does not use a programmable FPGA.
    The controller has a version number of '5' (0x00000005).
    The controller has an insertion length of '0' (0x00000000).
    This utility will attempt to reset the controller.
    This utility has successfully reset the controller.
    
    -----[Print the reset-command hardware log-file]-----------------------------
    
    The scan-path will be reset by toggling the JTAG TRST signal.
    The controller is the XDS110 with USB interface.
    The link from controller to target is direct (without cable).
    The software is configured for XDS110 features.
    The controller cannot monitor the value on the EMU[0] pin.
    The controller cannot monitor the value on the EMU[1] pin.
    The controller cannot control the timing on output pins.
    The controller cannot control the timing on input pins.
    The scan-path link-delay has been set to exactly '0' (0x0000).
    
    -----[Perform the Integrity scan-test on the JTAG IR]------------------------
    
    This test will use blocks of 64 32-bit words.
    This test will be applied just once.
    
    Do a test using 0xFFFFFFFF.
    Scan tests: 1, skipped: 0, failed: 0
    Do a test using 0x00000000.
    Scan tests: 2, skipped: 0, failed: 0
    Do a test using 0xFE03E0E2.
    Scan tests: 3, skipped: 0, failed: 0
    Do a test using 0x01FC1F1D.
    Scan tests: 4, skipped: 0, failed: 0
    Do a test using 0x5533CCAA.
    Scan tests: 5, skipped: 0, failed: 0
    Do a test using 0xAACC3355.
    Scan tests: 6, skipped: 0, failed: 0
    All of the values were scanned correctly.
    
    The JTAG IR Integrity scan-test has succeeded.
    
    -----[Perform the Integrity scan-test on the JTAG DR]------------------------
    
    This test will use blocks of 64 32-bit words.
    This test will be applied just once.
    
    Do a test using 0xFFFFFFFF.
    Scan tests: 1, skipped: 0, failed: 0
    Do a test using 0x00000000.
    Scan tests: 2, skipped: 0, failed: 0
    Do a test using 0xFE03E0E2.
    Scan tests: 3, skipped: 0, failed: 0
    Do a test using 0x01FC1F1D.
    Scan tests: 4, skipped: 0, failed: 0
    Do a test using 0x5533CCAA.
    Scan tests: 5, skipped: 0, failed: 0
    Do a test using 0xAACC3355.
    Scan tests: 6, skipped: 0, failed: 0
    All of the values were scanned correctly.
    
    The JTAG DR Integrity scan-test has succeeded.
    
    [End: Texas Instruments XDS110 USB Debug Probe_0]

  • The test connection result looks good.  What I am looking for you to do is to directly launch the debugger for the .ccxml file.  The reason I am asking for that is that your previous post showed XDS100 error messages again.  Thus I think the wrong .ccxml file is getting used or is being overwritten.

    From the target configuration view right click on the file and select Launch Selected Configuration.

    Once the debugger is launched you can click on the connect button and then load the program.  If that works we will have to figure out why an XDS100 based file is being used when you launch the other way.

    John

  • Hi JohnS,

    This suggestion partly solved my problem. Now I can load the program manually. But not an automatic way.

  • Ok lets see if we can fix the automatic part now.

    If you go to the properties of the project what does it show here:

    John

  • Hi John,

    Please see the pic. below:

  • That looks good.

    When looking at the targetConfigs folder in the project it should show the .ccxml file with [Active] beside it like this:

    When I go to the bug button, click the down arrow and select Debug Configurations.  I can then select my project on the left.  It will show me the target configuration file that will be used on the right.  That should have something like ${target_config_active_default: project name} where project name is the name of your project.

    I think that either something different is specified in the Debug Configuration dialog or that another .ccxml file is specified as "Default" and is overriding what is set by your project.

    It is possible to set a ccxml as default by right clicking on it and selecting "Set as Default Target Configuration".  It would then look like this:

  • Thanks John.

    This suggestion solved my issue.

    Kind regards